FNN Technical Analysis Roundup for March 29th
Technical Overview for the Major Movers
An overview of Thursday’s realtime forex price action for AUDUSD shows that the rate furthered its notable upward trend, as did NZDUSD.
USDCHF also rose on the day, but USDCAD fell, as both rates continued to trade in their most recent direction, according to the daily forex news.
AUDUSD Analysis
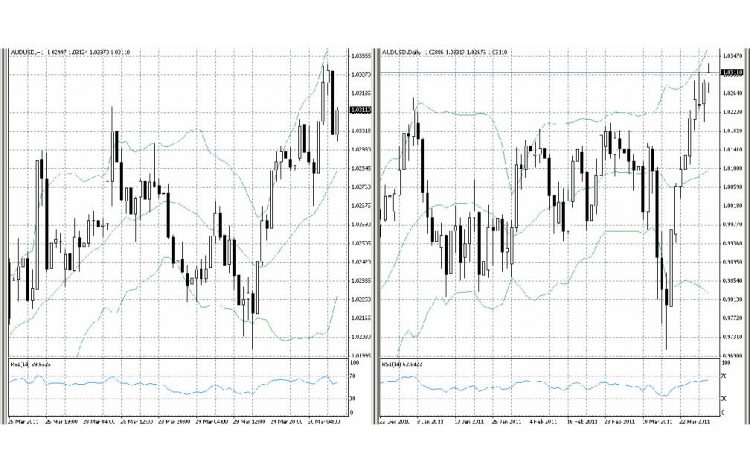
A technical AUDUSD analysis shows that the rate resumed its recent impulsive upward trend on Tuesday. The USD news reported that the rate pushed strongly beyond resistance at 1.0255 and even exceeded the previous high of 1.0313 seen on March 28th to reach a new post-float high point of 1.0332 early on Wednesday, before then coming off a bit.
The current up move began at 0.9704 on March 17th, and it brought AUDUSD back to test an important rising trend line now drawn at 1.0335 that may continue to offer resistance to the rate. In addition to this trend line, initial resistance for AUDUSD is now set at 1.0332 and then above that at the psychological 1.0500 level. Support now shows on the chart at 1.0255 and 1.0200.
The rate’s key 200-day Moving Average is now at 0.9633 and rising strongly. This indicates a bullish medium term outlook for the rate and its level should effectively limit downside price action until a significant trend reversal takes place in AUDUSD.
Furthermore, AUDUSD’s 14-day RSI has been rising steadily to where it is now approaching overbought levels during the rate’s most recent rally. The indicator is now reading in the upper part of neutral territory at 63 that could impede upside price action in the near term.
Hourly and Daily Chart for AUDUSD

Chart 1: Side by side Hourly (left) and Daily (right) candlestick charts of AUDUSD showing Bollinger Bands in pale green, its 200-period MA in red, trend lines in purple, and the 14-period RSI in pale blue in the indicator box below the charts.
NZDUSD Analysis
NZDUSD has recently been correcting higher off of its latest medium term low at 0.7115 seen on March 17th that is showing early signs of reversing its former medium term downward trend. Tuesday’s price action again pushed correctively higher to peak at 0.7580, while the rate went even higher to 0.7605 in early trading on Wednesday.
Further corrective upside price action remains likely for NZDUSD now that the rate has sustained an upside break of the upper resistance line of its down channel that has been in effect since the 0.7823 high of February 2nd.
Also, now that initial resistance at the 0.7553 level has been overcome, resistance for NZDUSD shows up in the 0.7654/65, 0.7785/91 and 0.7812/72 regions. On the other hand, look for the downtrend to reassert itself if key support at 0.7115 gives way.
USDCHF Analysis
USDCHF has recently been correcting higher off of its latest long term low at 0.8916 seen on March 17th within its overall medium term downward trend. Tuesday’s price action again pushed correctively higher to 0.9223, with early price action on Wednesday peaking above that at 0.9248 — a fresh recent high.
Although further corrective upside price action remains possible for USDCHF, the rate should eventually see selling pressure emerge if the medium term trend is to prevail. Furthermore, any short term corrective rally in USDCHF should meet initial resistance at the 0.9248 level and then above that at 0.9368 and in the 0.9774/82 region. On the other hand, look for the downtrend to reassert itself if key support at 0.8916 gives way, although 0.9139 will provide some support ahead of that..
USDCAD Analysis
After a corrective period higher that reached a peak of 0.9973 on March 15th, USDCAD has since been trading back down toward its latest long term low at 0.9666 seen on March 9th within its overall downward trend. Tuesday’s price action again pushed the rate lower to 0.9738, with a fresh recent low at 0.9724 already seen in the early part of Wednesday’s session.
Although another corrective C wave rally remains possible, USDCAD should eventually see selling pressure emerge if the medium term down trend is to prevail. Furthermore, any short term corrective rally in USDCAD should meet resistance at the 0.9973 level and at 1.0057 around the key psychological parity point. On the other hand, look for the downtrend to reassert itself if key support at 0.9666 gives way.


Comments (0 comment(s))