How to Spot a Breakout in Forex?
Perhaps one of the best online trading opportunities for forex technical analysts occurs when a classic chart pattern breaks out of its established formation on substantial trading volume and then proceeds towards its calculated measuring objective.
Furthermore, with a little practice and some basic forex education, just about all of the classic chart patterns are fairly easy to identify on the exchange rate charts for currency pairs that are typically provided by the top forex brokers who cater to retail trading clients.
This gives even the retail trader access to valuable technical market information that the best forex trader professionals regularly use to profit from exchange rate movements. The following sections will describe in greater detail how traders can spot a breakout and position themselves accordingly in their online trading account.
Spotting Triangle Breakouts
Triangle patterns are usually longer term patterns appearing on exchange rate charts for currency pairs provided by the top forex brokers that are characterized by two converging trend lines, although expanding triangles also sometimes occur. Triangles can be symmetrical, ascending or descending in shape, and they typically include five wave movements that are themselves each composed of three waves.
When a triangle pattern breaks out of either its supportive lower trend line or its upper resistance trend line, its measuring objective is equal to the height of its first wave projected from the breakout point. Figure 1 below shows a symmetrical triangle pattern that has broken out, and its measuring objective is depicted with white arrows.
Figure 1: A symmetrical triangle diagram with converging trend lines that breaks out to the downside toward its measuring objective shown with white arrows.
Spotting Range Breakouts
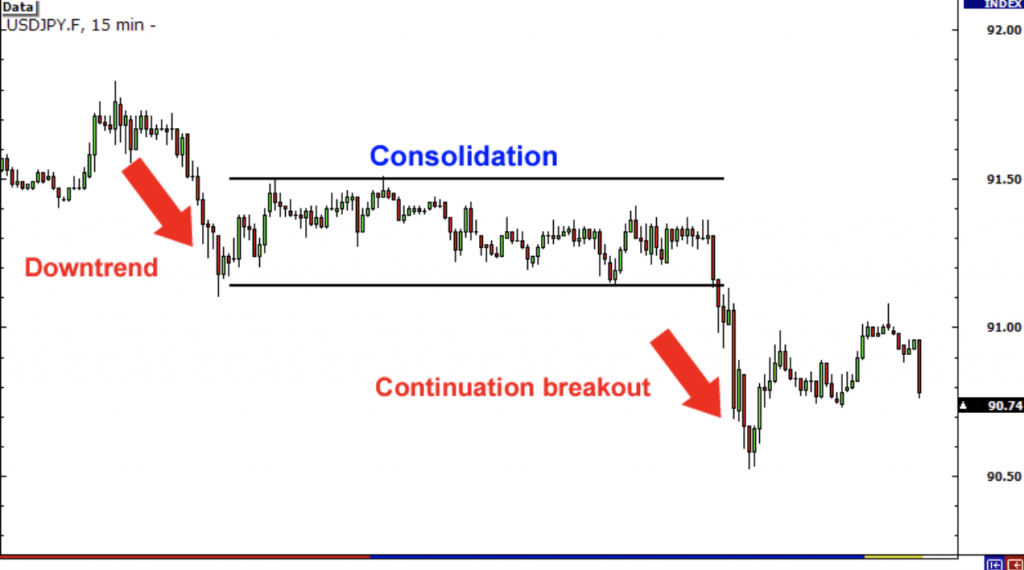
Trading ranges also often appear on exchange rate charts for currency pairs provided by the top forex brokers, and they are characterized by trading activity bounded by two parallel and horizontal trend lines, one lying above the market and one lying below the market.
When a range or rectangle pattern breaks out of either its supportive lower trend line or its upper resistance trend line, its measuring objective is equal to the distance between the two trend lines or the height of the range, which is then projected from the breakout point in the direction of the breakout.
Figure 2 below shows a trading range pattern that has broken out, and its measuring objective is depicted with white arrows.
Figure 2: A trading range diagram bounded by parallel trend lines that breaks out to the upside toward its measuring objective shown with white arrows.
Spotting Neckline Breakouts
The next type of breakout that the best forex trader types can usually spot is when a market is due to reverse and it breaks the neckline of a major reversal pattern. Such patterns often appear on exchange rate charts for currency pairs provided by the top forex brokers, and they include Double and Triple Tops and Bottoms, as well as Head and Shoulders Tops and Bottoms.
Figure 3 below shows a Head and Shoulders Top pattern that has broken below its neckline to the downside. Its measuring objective is depicted with white arrows. 
Figure 3: A Head and Shoulders Top diagram bounded by parallel trend lines, with the upper drawn at the head’s peak and the lower drawn at the intervening lows. This pattern breaks below its neckline to move toward its measuring objective shown with white arrows.
For more exclusive Online Forex News, follow us on Twitter or join us on Facebook.


Comments (0 comment(s))