What is the Relative Strength Index (RSI)?
The RSI or Relative Strength Index was originally invented by well known technical analysis innovator J. Welles Wilder. Wilder first published details on the bounded oscillator indicator in his book New Concepts in Technical Trading Systems in 1978 that is recommended for inclusion in any forex directory of seminal trading books.
Since the indicator’s initial introduction to the financial markets at that time, the Relative Strength Index has become one of the most closely watched technical indicators. The RSI remains an important strategic component of many trade plans and is often mentioned in technical forex reviews.
Furthermore, just about any technical analysis system or trading platform provided by an online forex broker that incorporates indicators will include a calculation of Wilder’s Relative Strength Index.
Computing the Relative Strength Index
The RSI indicator is calculated by comparing the size of the market’s most recent price rises to the size of its most recent price declines, and it is usually set up with a changeable time period parameter that is often put at 14 periods by default to reflect Wilder’s preferred parameter for the indicator.
The value of the RSI is also normalized and so it fluctuates or oscillates within a range bounded by a low value of 0 and a high value of 100.
Sample Chart of the Relative Strength Index 
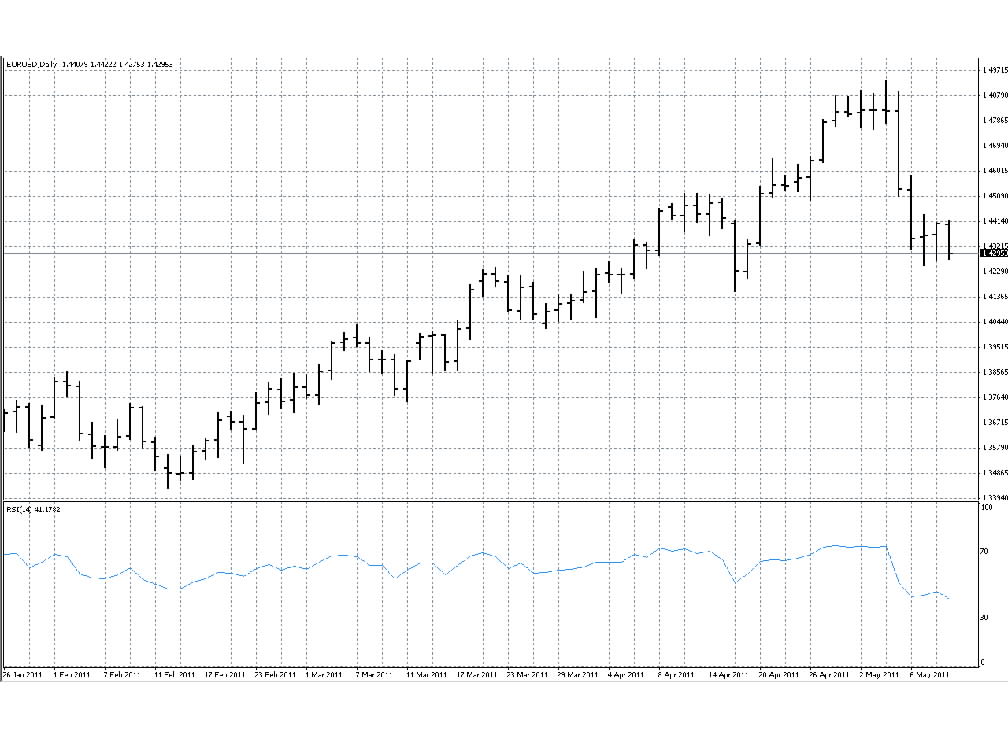
The graph depicted above is an actual daily bar chart for the EURUSD currency pair that has the 14-day Relative Strength Index or RSI(14) plotted in the indicator box in pale blue underneath the price action and on the same time scale. It was produced by the popular and relatively sophisticated MetaTrader4 forex trading platform supported by many online forex brokers.
Note the dotted lines at 70 and 30 in the RSI(14) indicator box that respectively show the boundaries of overbought and oversold regions for the indicator that can range from as low as 0 to as high as 100. The RSI(14) indicator shown had a current value of 41.1782 when this chart was obtained using a demo online trading account.
Applications of the Relative Strength Index
The RSI indicator has a number of important applications that modern technical analysts might use in their forex market analysis and mentions of it can be found at the websites of many foreign exchange brokers. Wilder originally presented the Relative Strength Index as a trading signal system that would signal counter trend trades when its peak or trough behavior diverged versus that of the price action.
Nevertheless, the RSI indicator has one of its most powerful applications when used in combination with other technical indicators. In such a situation, the RSI can be used to show when a market is overbought or oversold and hence may be ripe for a correction.
This characteristic of the RSI can help signal trend traders when to consider getting out of their trend following positions in order to reestablish them at better levels in the future in their online trading account.
Some swing traders also make extensive use of oscillator indicators like the Relative Strength Index. They trade via their currency brokers both with a trend and against it during correction periods, and the RSI can help them identify when a correction is likely to take place.
Such traders watching for corrections might look for extreme values of the RSI, such as over 70 for overbought markets and under 30 for oversold markets. They might also watch the RSI for the classic price-RSI divergence signal where the price makes a new high or low, but the market lacks the momentum to send the RSI to a new high or low.
For more exclusive content, follow us on Twitter or join us on Facebook.


Comments (0 comment(s))