Daily Forex Technical Analysis Roundup

Technical Overview for the Majors
A detailed analysis of yesterday’s realtime forex price action shows that the strongest exchange rate moves were seen in GBPUSD and USDCHF. Both of these majors rose on the day, as the GBPCHF cross rallied substantially.
Furthermore, a technical USDJPY and EURUSD analysis shows that both rates closed marginally higher on the day, demonstrating a more significant rise in the EURJPY cross. Both of these rates took a breather in today’s session after having experienced considerable volatility lately.
USDJPY Analysis
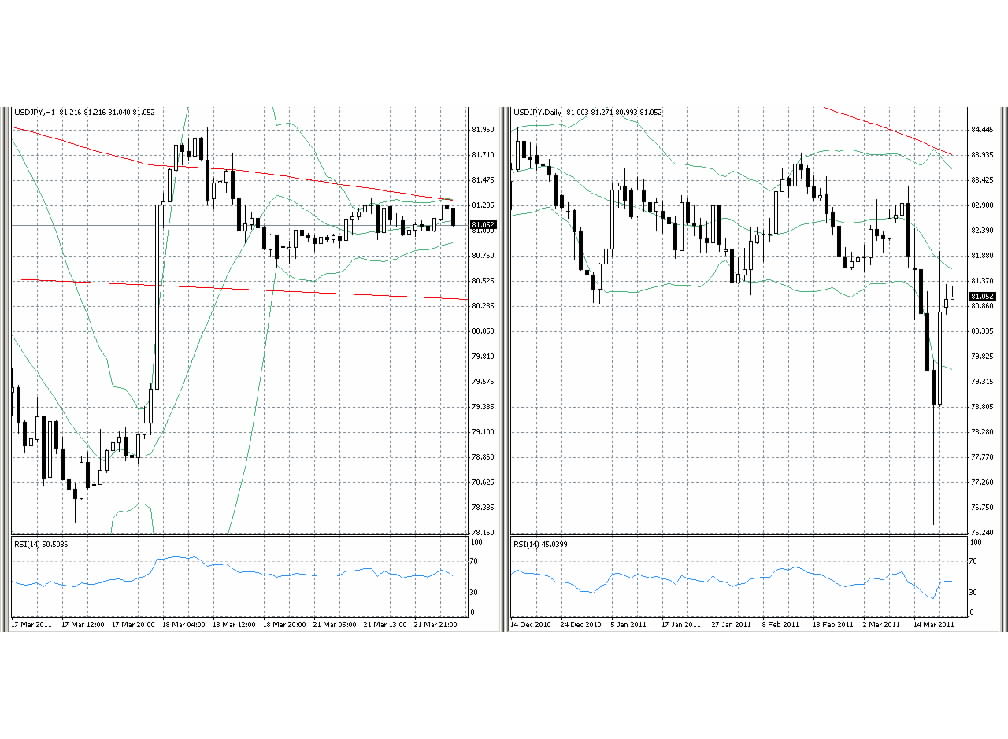
The chart for USDJPY is still being impacted by the rate having just made a fresh post-war low of 76.41 last Thursday. That level now remains key support to break in order to see further downside for USDJPY. Until that support point breaks, look for additional corrective activity to the upside to prevail.
Perhaps unsurprisingly then, USDJPY spent most of Monday’s session trading in a tight range between 80.70 and 81.30. A sustained breach of either side of this range should yield a measuring objective 60 pips away from the breakout point.
In addition, the rate’s key 200-day Moving Average is now at 83.94 and declining. This indicates a bearish medium term outlook for the rate and its level should effectively cap upside price action until a significant trend reversal takes place in USDJPY.
Furthermore, USDJPY’s 14-day RSI has now corrected its former oversold level seen during last week’s dramatic sell off and is now reading in the lower central part of neutral territory at 44 that should only mildly impede downside price action in the near term.
Hourly and Daily Chart for USDJPY
Chart 1: Side by side Hourly (left) and Daily (right) candlestick charts of USDJPY showing Bollinger Bands in pale green, its 200-period MA in red, trend lines in purple, and the 14-period RSI in pale blue in the indicator box below the charts.
EURUSD Analysis
EURUSD made a fresh recent high on Monday at the 1.4239 level within a rally that stretches back to the important 1.2873 reversal point last seen on January 10th. Look for this rally to extend further near term.
In addition, this latest high suggests that a reasonable Euro forecast would put the rate on target to attain the key 1.4281 reversal level of November 4th, 2010 in the coming sessions. Above that key resistance point, resistance showing at the 1.4579 level in EURUSD would then beckon.
GBPUSD Analysis
Cable rallied as far as 1.6327 on Monday and came just shy of the important 1.6342 high of March 2nd. The current up move began at 1.5343 on December 28th of 2010, and the latest impulsive rally from the 1.5976 region seems to have further to go before exhausting.
Once GBPUSD manages to overcome resistance at 1.6342, look for the rally to accelerate even more, with the next important resistance level showing up at 1.6456.
USDCHF Analysis
USDCHF has been firmly entrenched in a downwards trend since the reversal high of 1.1729 last seen on June 1st of 2010. Monday’s modest rally to an intraday high of 0.9074 was therefore corrective, and the rate should soon see selling pressure emerge if the medium term trend is to prevail over the coming sessions.
In particular, any short term corrective rally in USDCHF should have difficulty exceeding strong resistance at the 0.9201 level that extends as far up as 0.9368. Furthermore, look for the downtrend to reassert itself once key support at 0.8916 gives way.


Comments (0 comment(s))