A list of proven Forex indicators that actually work
Indicators are tools and strategies that you can use in order to maximize the effectiveness of your trades. Nearly every trader that has some experience in their portfolio uses at least 1 of these. But why should you use Forex indicators? The fact is simple and it is described in the name itself. Indicators indicate prices and changes in the chart. They help predict the way a market could go, which helps traders truly analyze the situation, compare them to the strategies they are using and incorporate the two for maximum efficiency in the way they trade.
But which are the best Forex indicators in the industry? How do you use them and more importantly why should you use them?
Picking the best out of a long list
Identifying the best indicators for you is hard work. It depends, mostly, on the kind of trading hat you intend to be doing on the markets. There is a wide variety of Forex trading indicators, as you will see below, and all of them have a specific purpose. The purpose of each indicator changes according to what they are trying to track, but the final results for some of the indicators are pretty similar. In the end, each indicator is hoping to help the trader by either identifying or predicting trends in the market, in a currency pair or in the attitudes of the market. The sheer number of indicators available on the market might make the final choice a little difficult, but once you know what you are going for, you should not have too much trouble. So, without further ado, let us dive into discussing some of the many indicators available online.
Stochastic Oscillator
First introduced in the 1950s by George C. Lane, this Forex indicator quickly became the norm for a lot of online Forex brokers.
The Stochastic Oscillator visually shows how the market’s most recent close looks relative to the market’s high-low range over a certain period of time. As a result, it helps traders quantify how extreme current price action is relative to how it has traded in the recent past.
These indicators make it clear to see, when to expect the next Forex breakout, or when a large slump in prices is going to happen. All by just analyzing the charts.
Relative Strength Index (RSI)
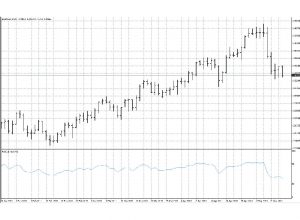 Relative Strength Index has been one of the best Forex Indicators for a long time now. First introduced to the public by J. Welles Wilder in 1978, it has since become on the most used Forex indicators in the market at this point. A tool which you can find a reference to in any Forex trading book or guide.
SImilar to the Stochastic Oscillator, the RSI indicator is calculated by a comparison of the sizes, of the market’s most recent price spikes to its most recent fluctuations. RSI trading is usually set up with a changeable time period parameter that is often put at 14 periods by default to reflect Wilder’s preferred parameter for the indicator.
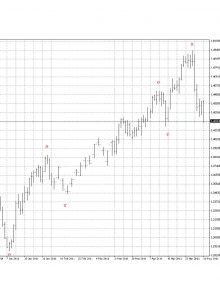
Tic, Line, Bar, Point and Figure Charts
Chart analysis is probably the most common way a trader analyzes a certain currency pair. Looking at the past may sometimes predict the future while also comparing it to the news articles you find on websites. Looking at the “tradition” of the chart increases and decreases show a common trend with other traders which helps in predicting the next “big decision”. Tic, Line, Bar, Point and Figure charts are one of the most common patterns out there.
Technical traders are the most common users of this Forex indicator, as they base their entire decision on trends and logic, in which the chart types listed above are arguably the best.
The Moving Average Indicator
Moving average indicators come in different shapes and sizes, and so do the ways of utilizing them. However, despite the large variety, they are still one of the most common Forex indicators for traders. The style of using them is quite simple and correlates to analyzing them in a certain way. For example, Moving Averages can be used to smooth data in order to help a trader better identify the prevailing trend, or Moving Averages of different time periods can be used in combination to generate trading signals when they cross over one another.
One of the most popular MAIs is The Average Directional Movement, which was invented by, you guessed it, J. Welles Wilder.
Bollinger Bands
The explanation of Bollinger Bands is quite simple. They are just a combination of two lines that are placed at equal volatility dependent distance, both above and below a central moving average line. The Bollinger Bands, you’ll find it surprising are were invented by John Bollinger, hence the name. Since the 1980’s introduction of the indicator, it became one of the best Forex indicators on the market.
The way Bollinger Bands work is that they illustrate the above and below lines of the central average, as I’ve already said. The way traders use them is that if the below band is broken, it means that the currency is oversold, which also indicates that traders are now going to buy the pair en-masse, moving it towards the above line, which triggers the opposite reaction to the one I mentioned.
The MACD indicator
 The MACD indicator is also known as the Moving Average Convergence Divergence indicator. Now after saying that mouthful of a sentence, let’s look at what it does. Basically, it’s a combination of a histogram and a signal line. It was invented by Geral Appel, who was able to turn it into one of the best free Forex indicators on the market right now.
For a detailed explanation of the MACD indicator click here.
Elliott Wave Theory
The Elliot Wave Theory or EWT is based on patterns, yes patterns. Technically it’s about observing the patterns of waves that are caused by price fluctuations, mostly driven by the marketplace.
R.N. Elliott the inventor of the theory concluded that these waves often included no more than five initial wave impulses, which were later on followed by a three wave correction.
This is the easiest way Elliott found to explain the patterns. There is another theory associated to his name called the Fibonacci Retracements and Projections which are a lot more advanced in dealing with subsequent impulses that tend to extend to Fibonacci ratios or Projections of the lengths of the preceding observed impulses.
Williams’ Percent Range Indicator
The most common users of this Forex indicator are technical Forex traders. By technical I mean people who spend 90% of their day analyzing and 10% making actual trades. Usually, this bounded oscillator indicator is used to determine extreme market conditions.
Similar to the Stochastic Oscillator Williams’ Percent Range Indicator, aka %R indicator shows how the market’s closing price for a particular pair relates to the highs and lows of prices, which were seen within a specific time frame.
Overall
There are some other indicators available on the market, but we haven’t the time or space to go into detail about them right here, right now. The ones we have described above are proven best Forex indicators our there in general, but they are not proven to be the best to you. This is why we encourage you to go ahead and try finding out more about all of the instruments, tools, and indicators available to you on the market.


Comments (0 comment(s))