What is the Stochastic Oscillator?
The Stochastics or the Stochastic Oscillator, as the important technical analysis indicator is more formally known, was originally introduced in the 1950’s by George C. Lane and is recommended for inclusion in any forex directory of important technical indicators. Furthermore, just about any technical analysis system provided by an online forex broker that includes indicators will have a Stochastics calculation.
Lane developed the Stochastics indicator to help financial markets traders identify extreme market conditions that could be ripe for counter trend corrections. The Stochastics Oscillator is usually normalized to range between the values of 0 and 100, with indicator values below 20 considered characteristic of oversold markets and values above 80 considered overbought.
From a qualitative perspective, situations where the market often closes around the high value of the Stochastics range tend to indicate that buying pressure is present and so a net accumulation of the asset is taking place. Alternatively, if a set of market closes that are near the low value of the Stochastic Oscillator indicator appear, this would reflect that selling pressure is present and so a net distribution of the asset is occurring.
Computing the Stochastics Oscillator
The Stochastic Oscillator graphically depicts how the market’s most recent close looks relative to the market’s high-low range observed over a certain quantity of time periods. As a result, it helps traders quantify how extreme current price action is relative to how it has traded in the recent past at their currency brokers.
Three kinds of Stochastics are commonly available that consist of the Full, Fast and Slow Stochastics Oscillators. Each of these indicators have the characteristic %K line that relates to the market’s close compared to the high-low range observed over a certain number of periods, as well as the %D signal line that is a moving average of the %K line.
The Full Stochastics commonly requires three key numerical parameters for its computation. They are the time periods of the %K line and the %D moving average, as well as a slowing parameter. Typical default values for these parameters would be 5, 3 and 3 and so a shorthand for this indicator with those parameters would be Stoch(5,3,3).
In addition, traders can often specify the type of moving average to be used to calculate the %D line, as well as what price range will be used for comparison to the current close. The usual default values for these are a simple moving average and the high/low price range respectively.
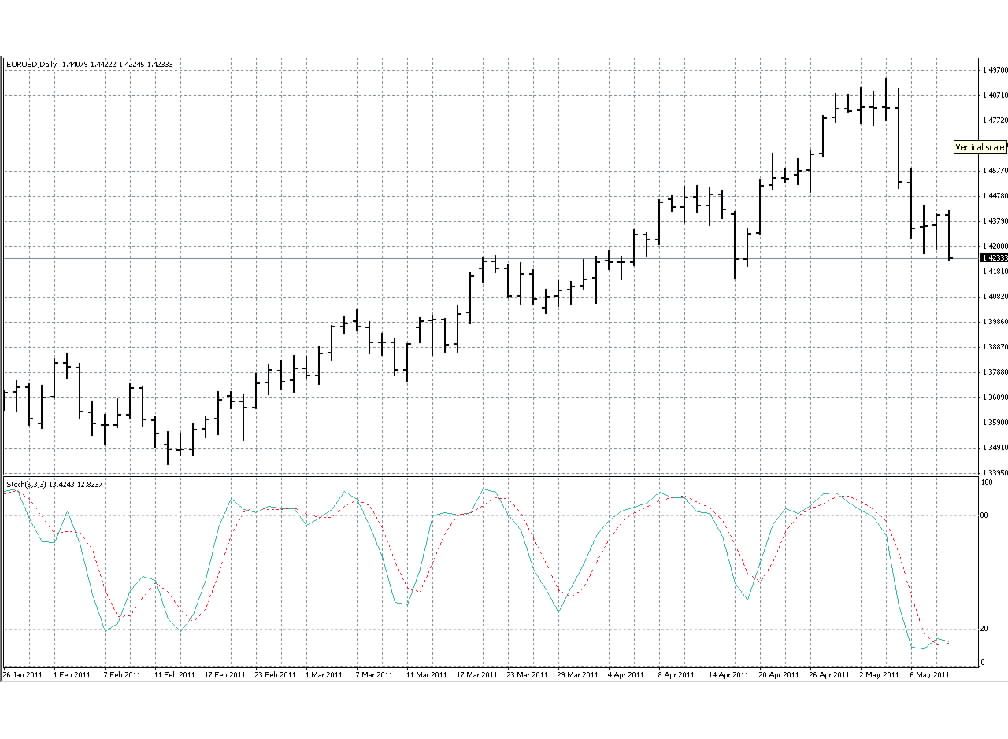
Sample Chart of the Stochastics Oscillator 
The graph depicted above is an actual daily bar chart for the EURUSD currency pair that has the two lines of the Full Stochastics Oscillator or Stoch(5,3,3) plotted in the indicator box in pale blue and red underneath the price action and on the same time scale. It was produced by the popular and relatively sophisticated MetaTrader4 forex trading platform supported by many online forex brokers.
Note the dotted lines at 80 and 20 in the Stoch(5,3,3) indicator box that respectively show the boundaries of overbought and oversold regions for the Stochastics indicator that is normalized and so can range from as low as 0 to as high as 100.
The Stoch(5,3,3) indicator shown had a current value of 13.4243 for the solid blue line and 12.8237 for the dotted red line when this chart was obtained using a demo online trading account, and it had recently generated a buy signal due to a crossover of the lines seen in oversold territory.
Applications of the Stochastics Indicator
The Stochastic Oscillator has a number of important applications that modern technical analysts might apply to their forex market analysis. The popular indicator can be found at the websites of many foreign exchange brokers and is often mentioned in technical forex reviews.
Lane originally presented the Stochastics indicator as a trading signal system that would signal counter trend trades when its %K and %D lines crossed over in oversold or overbought territory. In addition, the value of the Stochastics indicator can be used in combination with other technical indicators to show when a market is overbought (Stochastics>80) or oversold (Stochastics<20) and hence may be ripe for a counter trend correction.
This characteristic of the Stochastics can help signal trend traders to close out their trend following positions in their online trading account. Swing traders also use the Stochastics to trade via their currency brokers both with a trend and then against it during correction periods, and the Stochastics can signal when a correction is likely to take place.
Such traders watching for corrections might look for extreme values of the Stochastics, such as over 80 for overbought markets and under 20 for oversold markets. They might also watch the Stochastics for the classic %k/%D crossover signal in extreme territory.
For more exclusive content, follow us on Twitter or join us on Facebook.


Comments (0 comment(s))