What is Elliott Wave Theory?
Elliott Wave Theory is based upon the seminal work of R.N. Elliott who observed patterns of waves occurring in market driven price action. In his big picture market analysis, he concluded that these waves often consisted of an initial five wave impulse followed by a three wave correction.
The main advantage of using Elliott Wave Theory to analyze market price action when doing a comprehensive forex review is that the theory can provide clear objectives in both price and time for a trader to base their decisions on. This sort of forecasting can be quite useful to those involved in trading forex via online forex brokers.
Furthermore, performing a comprehensive Elliott Wave analysis can often substantially clarify the big picture unfolding in the forex market to a technical analyst that can assist them in making better trading decisions. Elliott Wave Theory can also make specific predictions about where the market should or should not go that savvy traders can use to the benefit of their online trading account.
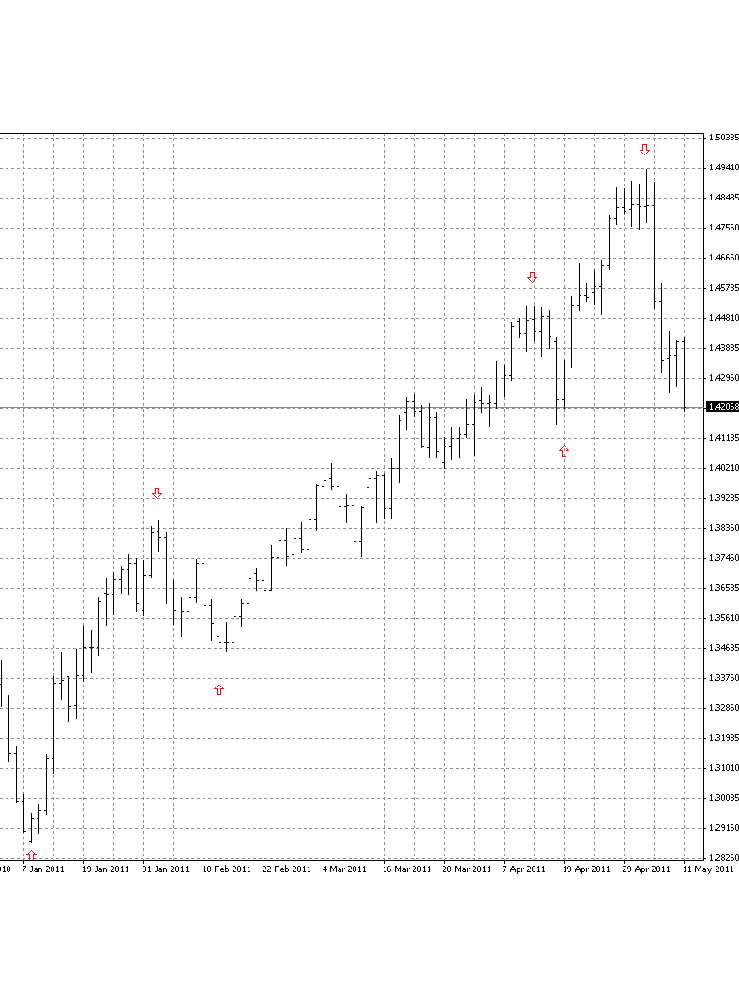
Sample Chart of an Elliott Wave Impulse The graph depicted above is an actual daily bar chart for the EURUSD currency pair such as one that might be obtained from currency brokers. The chart shows a classic Elliott five wave impulse having recently completed, with the end of its component waves numbered I, II, III, IV and V.
The chart also illustrates the start of that impulse’s subsequent A-B-C correction that has already penetrated into the range of the fourth wave of one lesser degree, which in this case is the price range delimited by the top of wave III and the bottom of wave IV.
The above chart was produced using a demo online trading account by the popular and relatively sophisticated MetaTrader4 forex trading platform supported by many online forex brokers.
The Basics of Elliott Wave Analysis
Although a detailed explanation of Elliott Wave analysis lies beyond the scope of this article, an Elliott Wave theorist would first usually perform a forex review of price charts for the major currency pairs to look for completed five wave impulses or three wave correction sequences. This helps give the analyst a starting point to begin their wave counts.
They might then compile a list of alternative wave counts, and wait to trade until a particular count clarifies itself as being of the highest probability. The analyst might then use this count to base their trading decisions or forex reviews on.
Although trending impulses generally come in five waves and corrections in three waves, counter trend corrections can also be of several different types, according to Elliott Wave Theory. These include:
- Zig-zags – sharp, three wave corrections that have an internal 5-3-5 wave structure.
- Flats – flatter, three wave corrections that have an internal 3-3-5 wave structure.
- Triangles – consolidative corrections within converging trend lines that have five internal waves of three waves each, typically counted A, B, C, D and E.
Fibonacci Projections and Retracements
Elliott also observed that corrections tended to retrace the preceding impulse by Fibonacci ratios of the length of that impulse. Similarly, he noted that subsequent impulses tended to extend to Fibonacci ratios of the lengths of the preceding impulses.
The percentages typically used by Elliott Wave theorists to compute these so-called Fibonacci Retracement levels are 23.6%, 38.2%, 50%, 61.8% and 100%. Furthermore, the ratios used for Fibonacci Projections are usually 1:0.618, 1:1, 1:1.236, 1:382, 1:1.500 and 1:1.618.
For more exclusive content, follow us on Twitter or join us on Facebook.


Comments (0 comment(s))