Trading Forex with the RSI
The relative strength index (RSI) is one of the most popular tools in technical forex trading.
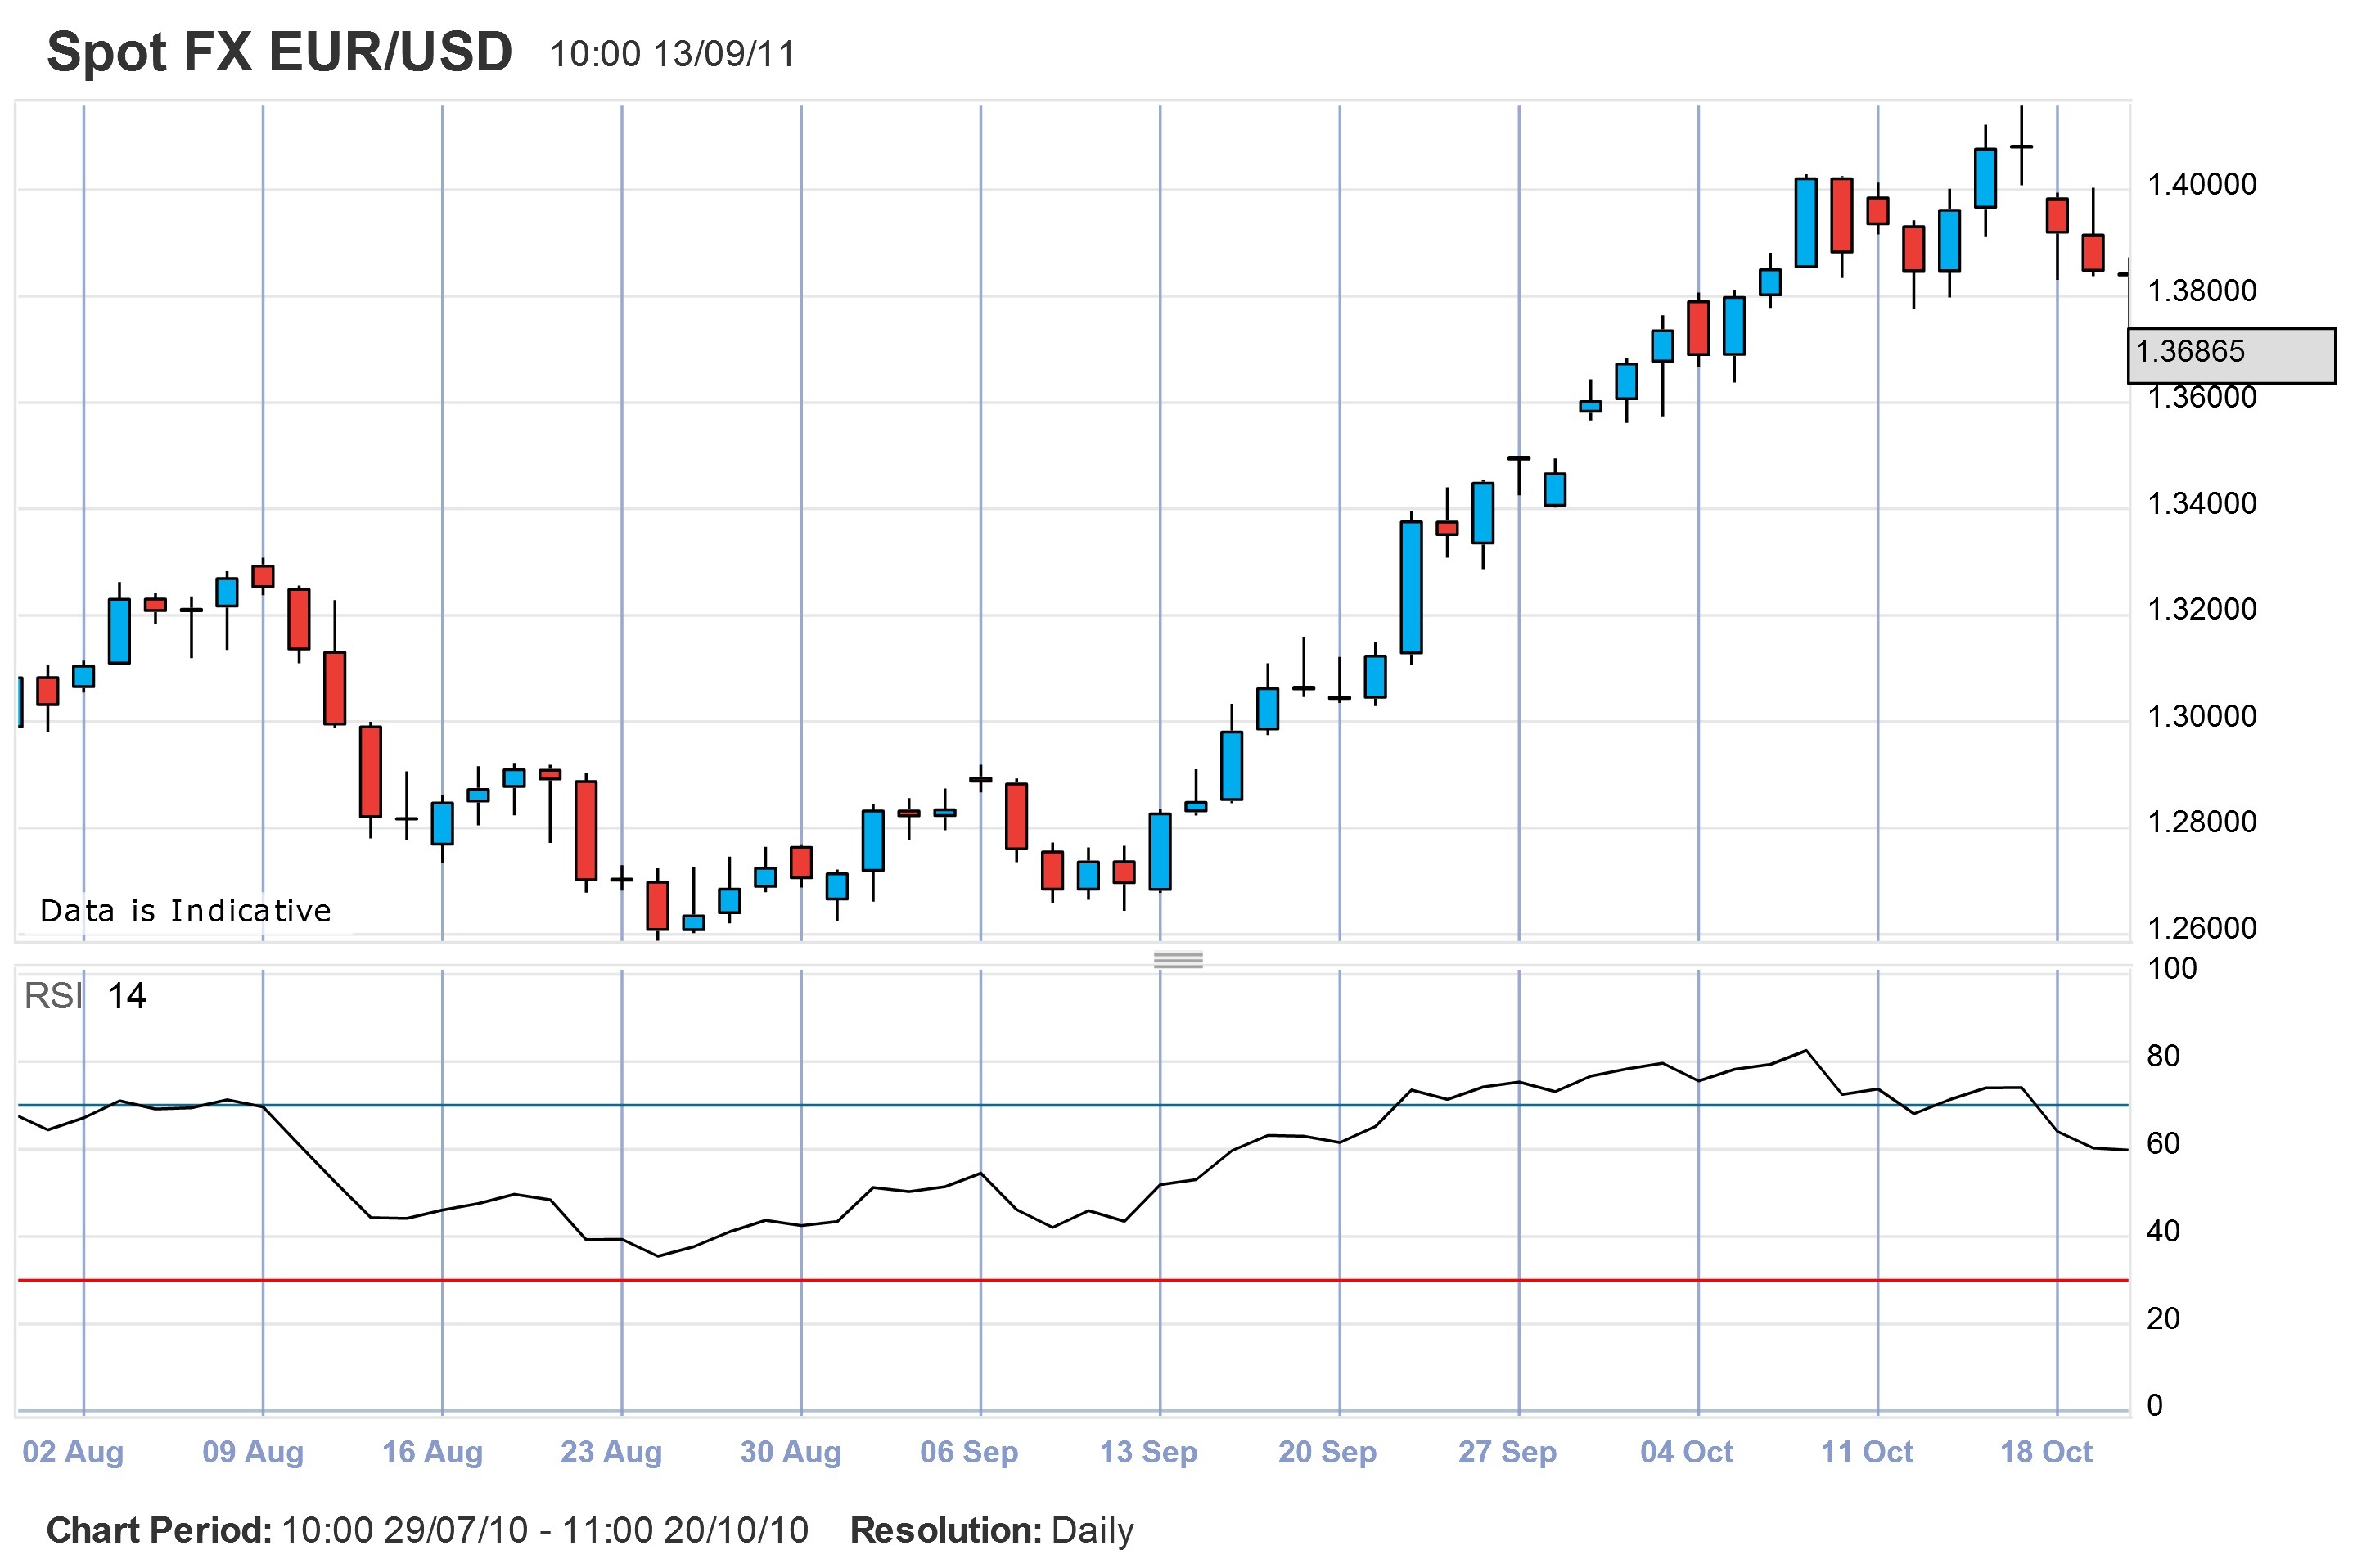
Plotted below a regular price chart, the RSI fluctuates on a range of 0 to 100. When it goes below 30, it indicates that a currency pair is oversold (meaning that its price is likely to go up as it corrects itself) and when it goes above 70 it indicates that a currency pair is overbought (meaning that its price is likely to drop).
Rules for the trade
- The RSI must be below 30 if going long, or above 70 if going short
- A candle should form and close with an RSI reading of greater than 30 for long trades or below 70 for short trades
- Go long at the open of the next candle
- Place a trailing stop using the Average True Range method
- Allow the trailing stop to close your trade
The benefit of waiting for a candle to close below 70 or above 30 once the RSI has indicated that a forex pair is overbought or oversold is that we have confirmation of a change in direction before trading.
Example using daily charts

If we look at the EUR/USD pair from July to October 2007, we can see the RSI rises above 70 three times. On July 10, the RSI hits 77.729. It stays above 70 until July 25, when the EUR/USD closes at 1.37225 and the down candle closes with an RSI reading of 53.909. As this reading is below 70, we can enter a short trade.
So you open a trade at 1.37226 (the open of the next candle) and set a trailing stop using the average true range (ATR) method.
The true range is the largest of:
- The most recent period’s highs minus the most recent period’s low (last candle’s high of 1.38265 – the low of 1.36965 = 0.0130, or 130 pips)
- The most recent period’s high minus the previous close (1.38265 – previous candle’s close of 1.38255 = 0.0001, or 1 pip)
- The most recent period’s low minus the previous close (1.36965 – 1.38255 = -0.0129, or 129 pips)
As the largest of the three is 130 pips we will use that as the basis of our trailing stop. A day trader might use a 10% stop, or 13 pips in this case. However, as the RSI remained over 70 for two weeks it is likely that this trade will also last for a number of days or weeks, so we place a trailing stop at 100% of the range, 130 pips (ATR stops for longer-term trades range from 50% to 100%. You need to evaluate how much of your capital you are willing to risk when placing yours).
After an initial drop the EUR/USD then starts to rise over the next week reaching a high of 1.38400 on August 5 before dropping. At its lowest it hits 1.33610, and your trailing stop follows it to 1.34910.
Your stop is triggered the next day, and you have made a profit of 231.6 pips, or USD2,316 (opening position of 1.37226 – closing position of 1.34910 = 0.02316, or 231.6 pips. Each pip is worth USD10, so USD10 x 231.6 = USD2,316 in profit).
Conclusion
Using the RSI as a trading indicator has many benefits, one of them being its simplicity. However, as there is such a wide range between overbought and oversold levels, it can be hard to see how long a trend will last.
Using a trailing stop can be a good way of enjoying unlimited profits with limited risk. However, the farther the trailing stop from your opening position, the greater your risk. For shorter-term trades it is recommended that traders place their trailing stops quite close to their opening positions, though in long-term positions this can result in you being closed out of a trade before it makes a sizeable movement. In the previous example the EUR/USD rose 117.4 pips before it started heading down again, meaning a smaller trailing stop would have resulted in you losing potential profits.
Traders can make more consistent, lower-risk profits if they use the RSI in conjunction with other technical and fundamental tools.
This article was written by Jacqueline Pretty – IG Markets – CFD Trading. No representation or warranty is given as to the accuracy or completeness of the above information, consequently any person acting on it does so entirely at his or her own risk. IG Markets accepts no responsibility for any use that may be made of these comments and for any consequences that result.


Comments (0 comment(s))