Groestlcoin (GRS) Analysis – Aiming the lower line of the triangle

Tuesday starts with the Groestlcoin, which for the past few days is in the down trend and is getting very close to trigger a major trading signal and most probably, that will be sell.
Since October 2017, GRS is in the sideways trend and is locked inside of the symmetric triangle pattern. We had a typical upswing in December and even more typical decline in January. No surprise here. What was unusual on this coin was the scale of the upswing in April, which almost got to the levels from the top of the bubble. Most coins had only simple corrections but the Groestlcoin had another bull run here. The outcome was the same though – a huge drop.
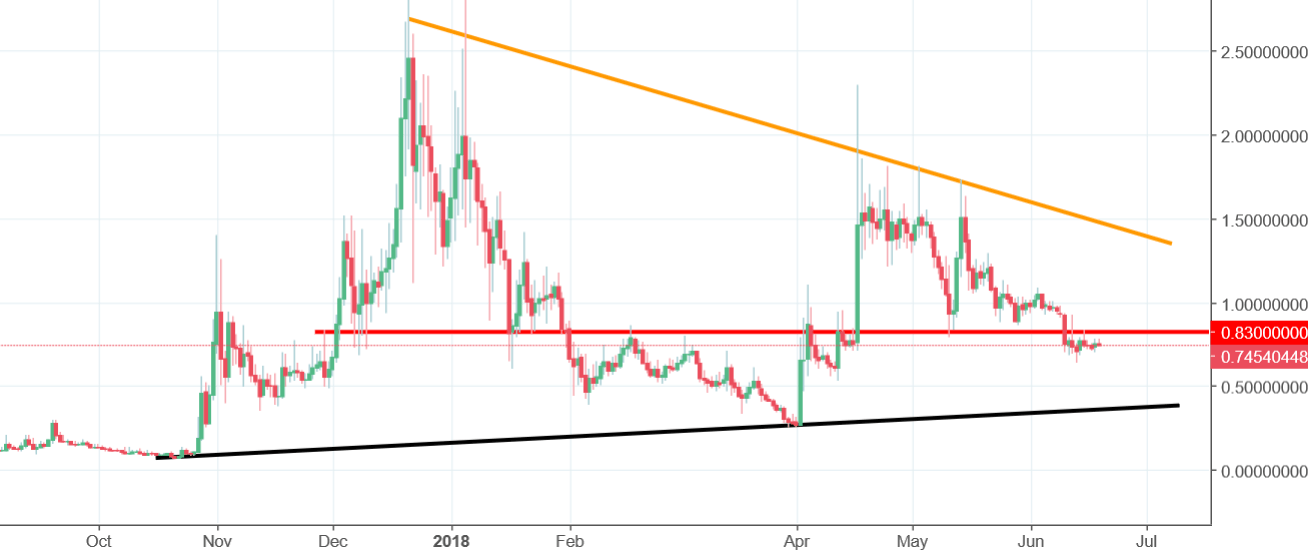
Currently, in the mid-term, we are rather negative. The price broke the horizontal support on the 0.83 USD and should continue to go lower. The first aim is the lower line of the triangle (black). In my opinion, after some time, that one should be broken soon and we should see a legitimate down trend, aiming new long-term lows.


Comments (0 comment(s))