WAX Analysis – Waiting for a breakout

Second instrument is WAX, which for the last time, was analyzed on this site at the beginning of November. Back then, we were below a psychological barrier of 0.1 USD and we were quite optimistic about the future. Our optimism was coming from the inverse head and shoulders pattern (yellow). Check it out yourself:
“November welcomed us with the highest levels since the beginning of August. Current resistance is the psychological barrier on the 0.1 USD. In my opinion, bulls should be able to break it soon. Our outlook will remain positive as long as the price will be making higher highs and lows. „
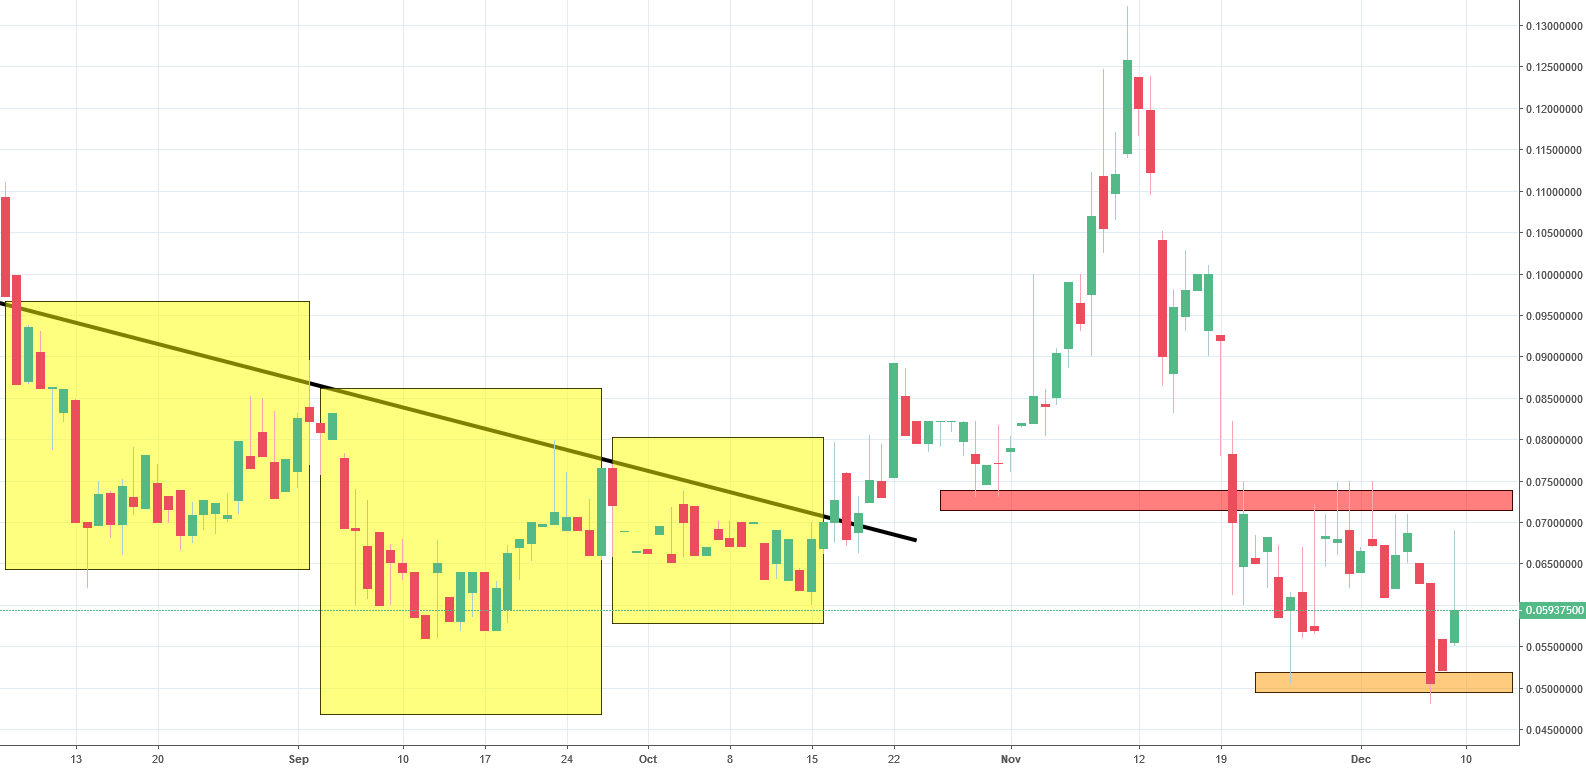
Another day, another dollar from our analytical team. WAX eventually broke that resistance and went 30% higher. If you managed to capture profits its fine. In not..well you should have as the price declined sharply. Currently, we are close to the long-term lows, locked in a sideways movement between the 0.05 and the 0.072 USD (orange and red respectively). The best way to trade this kind of movements is to buy the breakout of the red line and sell the breakout of the orange line. As long as we stay between, you should be position free, patiently waiting for a movement.


Comments (0 comment(s))