How to trade Forex with ADX indicator?
If you have spent any time at all on the trading markets, you know that there are a whole lot of ways of trying to find out whether the market is doing what you want it to be doing or not. One of such things is the ADX indicator. If you are a beginner Forex trader, you should definitely spend some time learning about the basics of Forex trading before you start getting into the more detailed concepts such as the ADX. Though if you are already aware of the trading basics, it is high time you get to learn about the indicators and how they can assist you in the trading process on the Forex market.
If you would like to find out more about indicators in general, you should check out some of the others we have talked about. While ADX is the ultimate trend indicator, there are also some other types, such as the momentum indicator known as the RSI indicator, that you should learn a little more about. These will help you understand which way the market is swinging and what the appropriate reaction to these changes might be. Now, let us get into the ADX indicator and what it is.

What is the ADX Indicator?
The ADX is an abbreviation the full name of which is defined as the Average Directional Index. It is an indicator used to determine how strong a certain trend currently present on the market is. So for example when you see a price for a certain asset going high, you can use the Average Direction Index to try and understand how strong the trend is and how likely it is to continue. This can help you see where the market is going and since any trend is a good friend of yours, keep up with it and invest (or divest) along with it. Understanding trends and conforming to them is an important part of trading on the Forex market. Not doing this is one of the biggest mistakes that beginner traders make, among all the others. These mistakes usually cost beginners a lot of money.
In order to showcase how strong the trend is, ADX uses the moving averages of price movement ranges in a certain timeframe. Just like with every other indicator, the setting is usually 14 bars, initially, but can be altered on demand of the user attempting to use it. The good news is that the ADX can be used in most trading platforms without an issue. It is usually displayed as a single line plotted against a number of other possible directional indicators, as a way of providing information that can be cross-referenced with other sources of information. There are also other ways that you can use it, such as the ADX arrow indicator mt4 can be modified to provide. It is a simple modification of what the indicator showcases, but can also allow you to devise some new strategies in how you trade on the FX market.
The ADX is usually plotted on a 0-100 scale, and then cross-referenced against the DMI. The cross-referencing allows the trader to determine how strong the uptrend or downtrend is, and allows them to start thinking about whether they want to be a part of the trend or not. The thing is – how do you determine a potential entry point? Well, the ADX indicator does not necessarily let you determine that, but there is a way that allows you to determine that on your own. Most of the good Forex brokers offer most of the indicators in some basic form on their platform, ADX included. Learning about them is what will allow you to always have a chance to identify trends on the market, as long as you know what you should be looking for.
How to use the ADX Indicator for MT4?
Using the Average Direction Index within the confines of Forex trading platforms depends on the platform itself. Today we are going to talk about how to do this with the MT4 platform. the first thing you are going to need to do is to enable the indicator within the options of your platform. The first thing you are going to need to do is to make sure that you have the MT4 platform. If you do not, go ahead and download it.
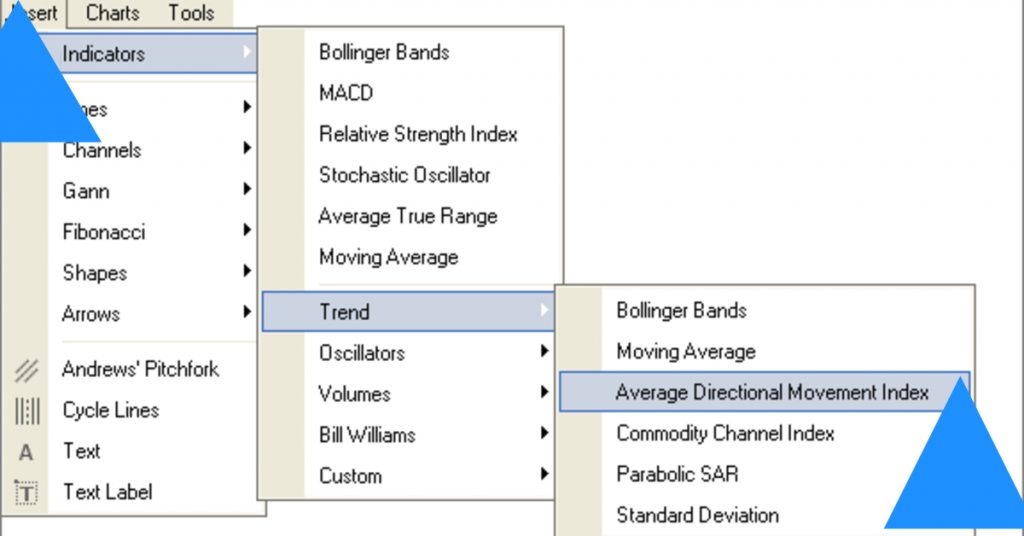
If you have downloaded it already, then simply turn it on. When it is on, move your mouse over the towards the insert tab and press it. Within the menu that appears, go to the indicators option. Follow that with the trend option and you will see a menu of several indicator options pop up. This is where you will find the Average Directional Movement Index, which is what you want to click on.
Once you have clicked that, you are one step closer to setting up the best ADX indicator Forex platform will allow you to set up. What is left is to define the parameters you are going to be wanting for your indicator. The two types of parameters are the calculations and visual. Set the parameters as you want them to be, and bam, magically you have acquired an ADX indicator on your platform. You can change the parameters of your indicator at a later date.
Alternative ADX indicators
The vanilla MT4 indicator is pretty useful, but it is also pretty limited, especially for those of you who like to get a little bit more info out of their indicators. This is why there are some other options out there that will allow you to work a bit more efficiently (or a bit more like the way you prefer). Here is a quick list of options and what they will allow you to do:
- ADX arrow indicator – this is a relatively advanced ADX indicator that can be used in the MT4 platform, which will allow you to see in more detail where and what the trends are looking like. The arrows will provide you with more information regarding the signals that the ADX indicator is providing you with, in terms of trends and good entry points. A relatively useful tool, if you are capable of understanding of what the indicator is telling you and when.
- Advanced ADX indicator – The internet is full of some other advanced versions of the ADX indicator, modified by the community and made to provide a little more visual information regarding the market trends, price points as well as providing signal alarms and possibly some automated features. A lot of these are free, but some of them have a price on them. If you do find an ADX indicator that someone is asking you to pay money for, make sure there isn’t a free version of the indicator already available on the internet. Also, make sure that what you are downloading is a legitimate piece of software, otherwise you might encounter malware and end up losing a lot of money and possibly information.
How to read ADX indicator
So, how do you use and read this miracle technology? Well, it is not the most complicated thing in the world. The idea of the indicator is simple, all you need to do is grasp the basics and try to understand what the best way of going about reading it is. The ADX Wilder Indicator is also known as the Wilder’s DMI. This breaks down into Wilder’s Directional Movement Index. This is the ADX. What happened is that a certain J. Welles Wilder took the directional movement indicators available in the late 1970s and he combined them to develop the ADX, which was named after him. The result is three lines, all of which are related to each other and provide information regarding directional trends and reasons for these trends, while also contextualizing the trends and giving traders a chance to see if they want to invest at that point or not.
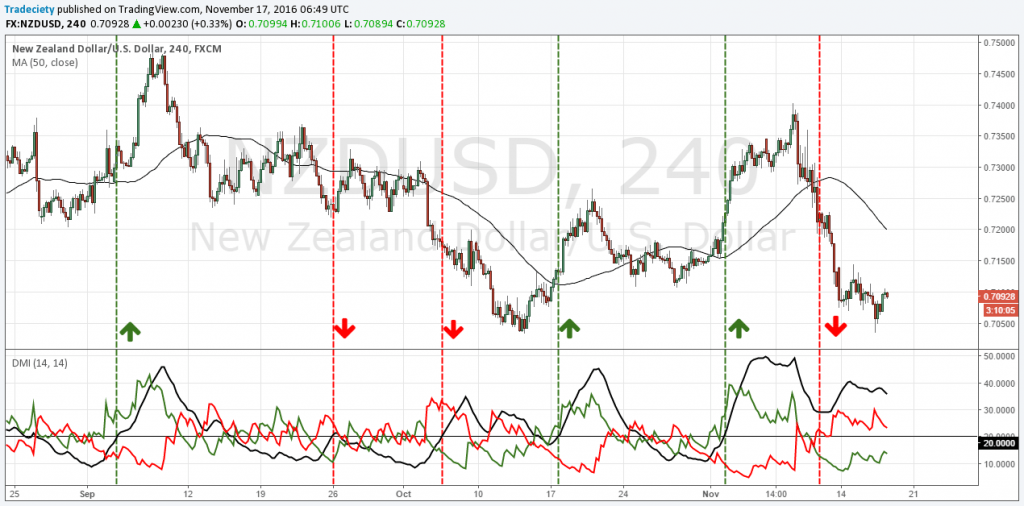
When trying to identify an ADX indicator trading strategy, what you need to be looking at are the three lines shown to you. Two of the lines are the DMI+ and the DMI-. These two show the price directions of an asset. If the DMI+ is above the DMI-, then the price trend is positive and the price is going up. When the DMI- is over the DMI+, the price trends are negative and the asset value is going down. This information is pretty simple and you can put it relative to the third line, which is the ADX. This line provides you with the information regarding the strength of the trend shown. If the trend is ADX line is way up, you can be sure that the ren is strong and may even persist for some time. You can use this information in devising your trading strategy.
So for example, traders preferring to go into long-term positions might set a long position when the DMI+ goes above the DMI- and the ADX shows that the strength of the trend s high. On the other hand, the ADX indicator intraday traders might find themselves setting positions even on weak trends, as long as their position does not last too long. While this is risky, limiting the time of the position will allow the traders to earn some profit even on risky endeavours such as this. Though this is entirely up to the trader themselves – risk-averse individuals will be less likely to start weak trend day trading. The traders will also often pay attention to how close the DMI+ and the DMI- are to each other. The further apart they are, the more volatile the price of the asset is. The closer they get together, the more stable the exchange rate between two currencies is.
Forex ADX indicator trading strategy
As mentioned above, the strategy of the trade is highly dependent on the trader themselves. One thing is true for all traders on the Forex market though: the Average Directional Index indicator is one of the most important and one of the most trustworthy directional trend indicators you could ever work with. While some indicators might not be too reliable in the signals they provide, the ADX has a tendency to be extremely reliable. Though it does not necessarily give out information and signals regarding good entry points for an asset. Which is why the advanced indicators try to provide a little more information in this context. Still, it is important to work with the ADX in combination with some of the other indicators available, even if they are less reliable in their signals. The ability to see, for example, what and RSI indicator is saying, in combination with the ADX providing some indication of the trend strengths, is what will allow you to become a safer, better and more successful trader. All you have to learn is how to read ADX indicator forex -wise contextualized and supported by some of the other indicators you might want to start using during your trade time.
ADX indicator calculation
As mentioned before, the calculating the Advanced Directional Index is done through the calculation of average price points within a certain timeframe, as a way of determining the strength of one trend or another. While this means a lot to some of us, it might as well be written in a foreign language to others. The concept is not that complicated in of itself – average prices and the direction of their movement are capable of showcasing the strength of a trend. Looking at the range at which the price, the speed and the strength change are what provides us with the information we need regarding the strength of the trend. In reality, not everyone will need to know the actual ways of calculating the ADX. In order to use the ADX indicator Forex strategy, all you need to be able to do is identify the trends and see what the ADX is trying to tell you. Anything beyond that is going into the field of math which, while is highly encouraged, is not necessary for successful trading on Forex.
Here is a quick rundown on the ADX Indicator how to use details, so you are more aware of what you are looking at when trying to use the indicator. The trend strength is usually quantified on a 0 to 100 scale, as mentioned above. The scale is separated into four segments, with each signifying something regarding the strength of the trend. 0-25 is a weak or nonexistent trend. 25-50 is a strong trend. 50-75 is a very strong trend and the final segment, 75-100 is the extremely strong trend that you should be extremely excited for. Knowing this will already allow you to start using ADX in your daily, weekly and monthly trading strategies.


Comments (0 comment(s))