What is the Relative Strength Index RSI Indicator?
If you have done any stock market trading over the years, you will know for sure that there is a thing called RSI indicator. You also probably realize that you need to understand what this thing is if you want to trade successfully. Except you can’t figure it out, which is why you have come to us. You want to understand what the RSI indicator is and you also want to understand how you can use it. Whether you want to figure out how to use RSI indicator for day trading or other strategies of your choice, you need to understand the overall importance of the concept to be able to apply it successfully.
Generally saying, the RSI indicator is a tool to assist you in seeing the trends that stocks are going through at the moment. It shows you whether things are going well, or badly and it can be used as a signal to buy or to sell certain stocks. Let us get into more detail below, so you can understand the concept better. It is also one of the basic concepts all beginner Forex traders should learn about.
RSI indicator explained
Reiterating what we said above, because it is a pretty alright summary of what we are trying to get into, the RSI indicator is a tool used in stock markets and other markets as a visual indication tool for how a certain stock or item is performing. The RSI is an abbreviation that breaks down int three other words: relative strength index. Which is why when you say RSI indicator, you’re kind of messing up, but it sounds better than just saying RSI, so let us keep doing it. So what are we talking about when we mention these three words? Let’s get into it and try to understand through them what the RSI indicator is.
Relative, in this context, means that the tool is attempting to portray the happenings over time, in relation what came prior to the changes presented by the indicator. Strength signifies the strength of the stock or of the momentum of the trend that the stock is part of. Finally, the indicator stands for what would expect – an indicator. Now to contextualize it a little bit and try to understand what the tool does on the market. Market professionals categorize it as a momentum oscillator, which means it measures the direction and the velocity forces of the price changes of stocks and valuable assets. The RSI momentum indicator works to show us which way the market is leaning on one asset or another, which way the momentum is pushing the said asset and what the expectations for the changes should be. RSI can have a value anywhere between 0 to 100, but rarely hits either one of those marks, with the most extreme oscillations usually ranging to a maximum of 90 and a minimum of 10, though nothing is impossible as they say.
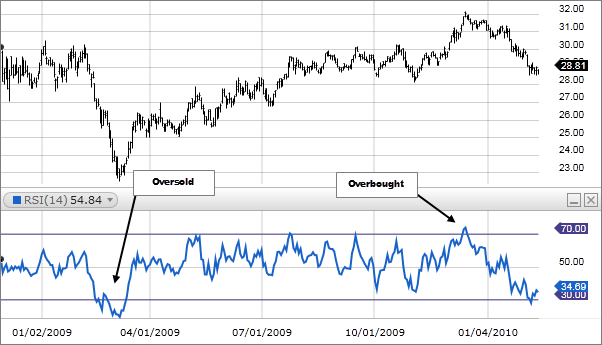
Effectively using the RSI means understanding what the line graph is showing and what might be happening. It is an effective tool that will help you understand when to buy and when to sell and can be used in Forex as much as it is used in the stock market, as long as you understand what you are looking at and are patient enough to follow what the oscillator is telling you. The RSI indicates when a certain asset is either overbought or oversold. At the most basic level, it is usually accepted that any asset sitting at a level higher than 70 is already overbought, meaning its value is being overestimated, while the assets under 30 are undervalued, meaning that they are undervalued. Though more nuance goes into understanding when to actually start buying and selling.
RSI buy and sell signals
So let’s talk about the nuances of overvalued and undervalued stocks and the signals that an RSI is capable of giving us, in order for us to understand when we should be buying or selling. As mentioned before, at its most basic, the relative strength index is capable of showing information regarding overvalued and undervalued assets, which could be interpreted as buy and sell signals. But simply waiting for a certain value to happen and then immediately buying or selling will cause you to do irreparable damage to your funds. To apply the RSI tool appropriately and well, you need to understand some of the techniques that professional traders use to understand what is going on within the market.
The RSI indicator is capable of entering uptrends, downtrends and sideways trends, which all showcase a certain attitude on the market. An uptrend of the RSI indicator showcases the rising value of an asset, while a downtrend shows a falling value. An RSI trend may last longer than certain upticks and downticks within the timeframe. So while at certain points either one of the short-term trends might be present, the overall trend might be slightly different. To explore the idea a little further, let’s consider the 30% and the 70% per cent lines – these are usually the upper and lower limits showcasing the valuation of the asset. Though there have been scholars who say that the RSI signal indicator might show up or downtrends much earlier. It is considered that the range of 50%-60% acts as a resistance area for the valuation of a specific asset. So if at some point the RSI of goes down to 50%, it might be an indication of an oncoming bearish market. The RSI going back up to the 50% during a bearish market does not necessarily mean the end of a bearish market, as this simply could be a peak and a point of resistance that the valuation of a specific asset will not be able to cross.
It is important that once you start using the RSI indicator you also start utilizing trading signs in order not to get caught up in the false alarms that RSI might cause. Especially, if you are a beginner trader, the RSI might be a tempting tool to always follow. While useful, the tool is also capable of producing false alarms and causing you to make mistakes as a beginner would. One way to avoid this is to use bullish signals when the price is in a bullish trend and to use bearish signals when the price is in a bearish trend. This way you will have the ability to avoid some of the false alarms that might be produced by the RSI.
When tracking trends with an RSI, you might start noticing some interesting things. If a trend lasts a while, it will have peaks and valleys, but eventually, the trend will ring itself to the highest, or the lowest, level it has been for a while. Usually, this will be shown by a dramatic rise or fall to a certain point, beyond the usually expected overvaluation or undervaluation point. It will stay at the point for only for a bit until it will turn back and start going towards its previous levels. This might be a sign that the trend has brought itself to an end and will be changing. RSI exhaustion indicator tracking allows traders to keep track of when a trend might turn around and turn into a different trend. This allows for very simple adjustments in trading strategies to happen fast, so that the trader will easily adapt to the coming changes in the market and prepare to make their profit differently from how they were doing it up to now.
Understanding how to use the RSI Indicator Chart
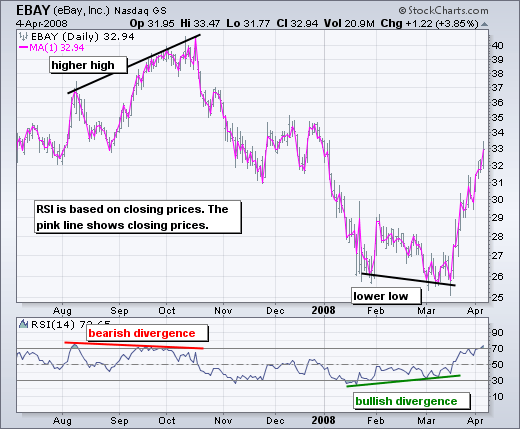
The RSI char is good at indicating the rends within the market, but understanding how to use the chart effectively is still important. There are two concepts that you need to know to be able to apply what you see on the graph to your trading strategy. The first thing you need to consider is the Divergences that happen between the prices represented on the market and the RSI graph. There are two types of divergences, bullish and bearish. The first happens when the RSI shows an oversold reading and creates a higher low than that matches the corresponding lowest lows in the market price. This means that the market is entering a bullish momentum on a specific asset and means it might be time to start considering a long position if a break over oversold territory occurs. A bearish divergence is the direct opposite of this: once the RSI creates an overbought reading that is followed by a lower high than the corresponding highest high of the market price.
These divergences could be used as a simple RSI indicator strategy tool for strategy creation to base your trading on in the future.
Something else you need to look out for is swing rejections. This concept is usually applied to bullish swing rejections. Such a swing rejection is composed of four parts. First, the RSI falls into oversold territory. Then the RSI crosses back above 30%, which is followed by a second dip that does not cross into a oversold territory. Finally, the RSI crosses its most recent high position. Of course, there is also the bearish swing indicator, which is the exact opposite of the bullish one.
How to use RSI indicator for Forex
Now that you understand the basics of RSI, you might want to start utilizing it in your trading on Forex. I don’t blame you, it is probably one of the best tools for any investor out there. It helps you understand what is happening on the market while also providing you with useful information regarding how you should be adjusting your trading plans for the near future. With the Forex markets being rather volatile right now, it is a good tool to be able to predict some the more significant investments or divestments you might want to start making. The RSI indicator Forex -wise does come with the program but you will have to figure out how to make it one of the main visible indicators for you. Most Forex Brokers will offer you an option to use the indicator within their trading platforms, whether it is the Meta Trader 4 or the Meta Trader 5. As long as you know what you are doing, adding an RSI indicator is one of the easiest things to do on the platform. So let’s talk about how to set up RSI indicator for yourself.
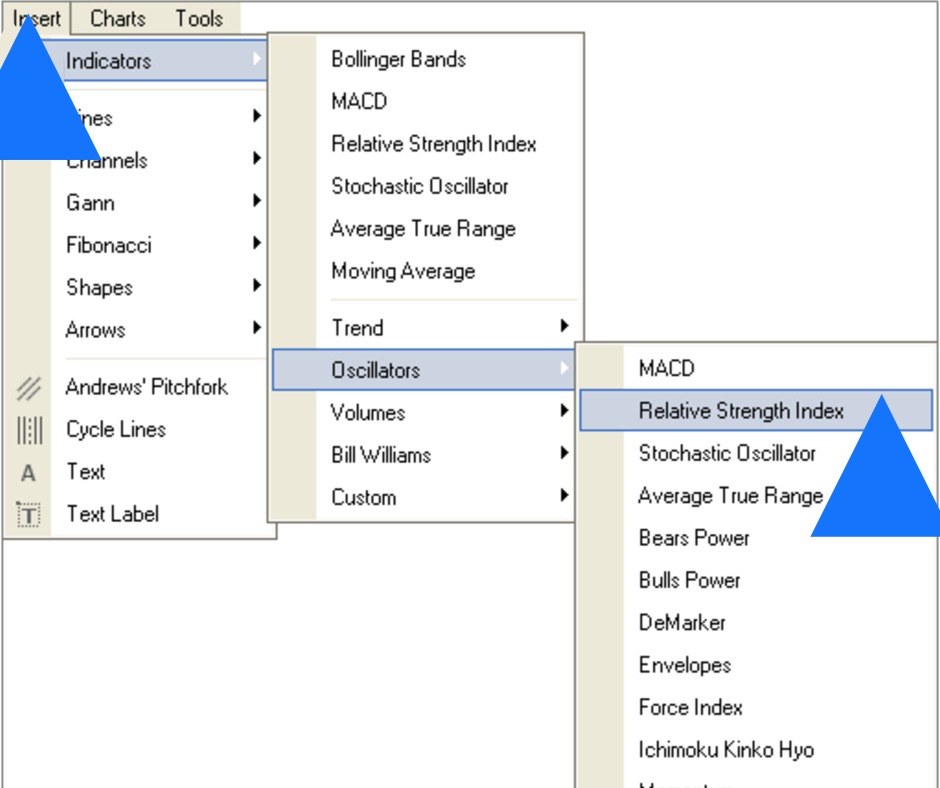
Well, the first thing you are going to have to do is figure out which Meta Trader version you are using. After you have done this, you need to figure out whether you just want to RSI indicator, or whether you want to set up signals for yourself as well. First, let’s bring the RSI to the front of the platform. Turn on your platform. After it is on, press the Insert button. Go to the Indicators menu and follow-on to the Oscillators menu. Here, select Relative Strength Index. After you have done this, a settings menu pop up should come onto the screen. You need to specify two parameters: the calculations of the indicator and the look of your RSI indicator. And done, we have set up your beautiful RSI, but you might also want something else added to your RSI. What if you want a color RSI with alert indicator to be working for you? Well, that is not as complicated as it sounds.
Setting up your RSI indicator buy and sell signals MT4 wise is rather simple. The only problem is that the RSI indicator included within the platform does not come with the alert feature that you are looking for. Though there are a number of tools on the market that offer this service. The upgraded versions of the RSI indicator can be easily found and downloaded on the internet, with a number of trustworthy companies offering the product to you. You might have to pay a little extra for it though, so make sure that whatever you are buying is really what you are looking for. Otherwise, you could also scour some of the biggest Forex trading platforms to find versions that might be free, but do not download anything you are not 100% confident about. The internet can be a dangerous place, especially if you are looking for free things.
Final thoughts on the RSI Indicator
There are several final thoughts that we would like to share with you regarding this indicator. The first thought is that the tool is very useful, but also rather dangerous if you consider how many false alerts it might be providing for you. Before you start relying on it too much, you should gain more experience working with it, so you hopefully can avoid making big mistakes because of your inexperience. Some of the most successful traders in the world have utilized this tool to their great benefit.
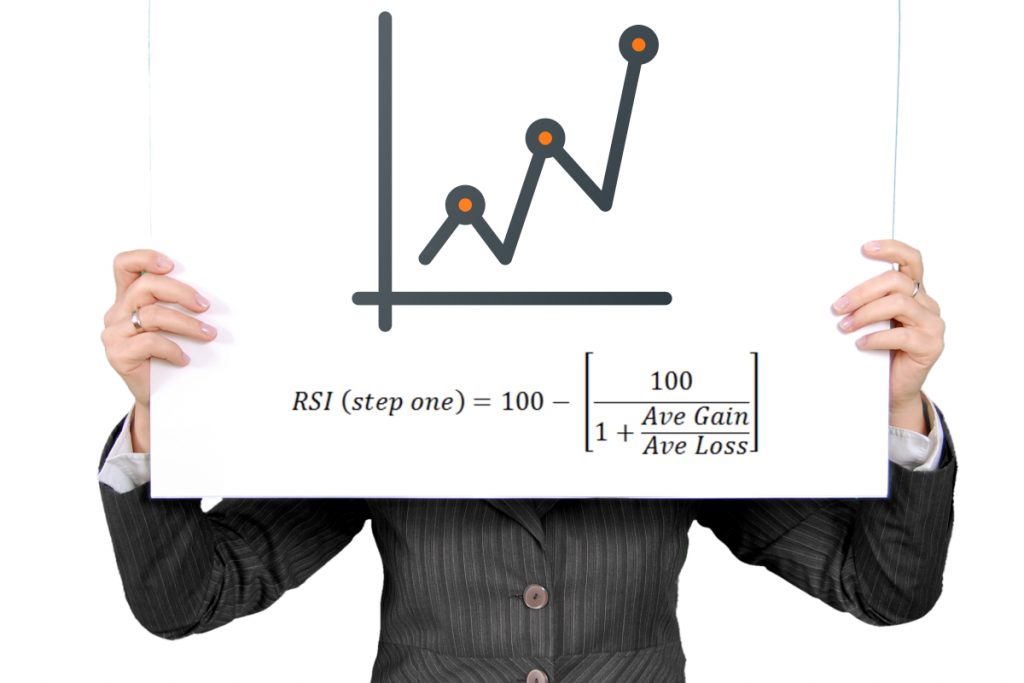
The RSI indicator comes from a simple mathematical formula that has the goal of understanding the percentage changes from one point to the other within the context of the market price of a certain asset. Learning more about the formula might seem like a useful thing to do to you, but unless you are trying to study the mathematics behind the RSI indicator, it might not be too useful for you.


Comments (0 comment(s))