Bitcoin Diamond Analysis – Double bottom?

Another piece of the day is the Bitcoin Diamond, previously mentioned by us on the 31st of July. In this piece, we were bearish and the price was around 15 USD, just after bounce from the horizontal resistance on the 18 USD. That was the day, when the BCD got fresh sell signal:
“Sellers managed to defend this level and today, bears decided to throw a decisive punch – the price broke the black line connecting higher lows. That is a direct trigger to open a short position here. „
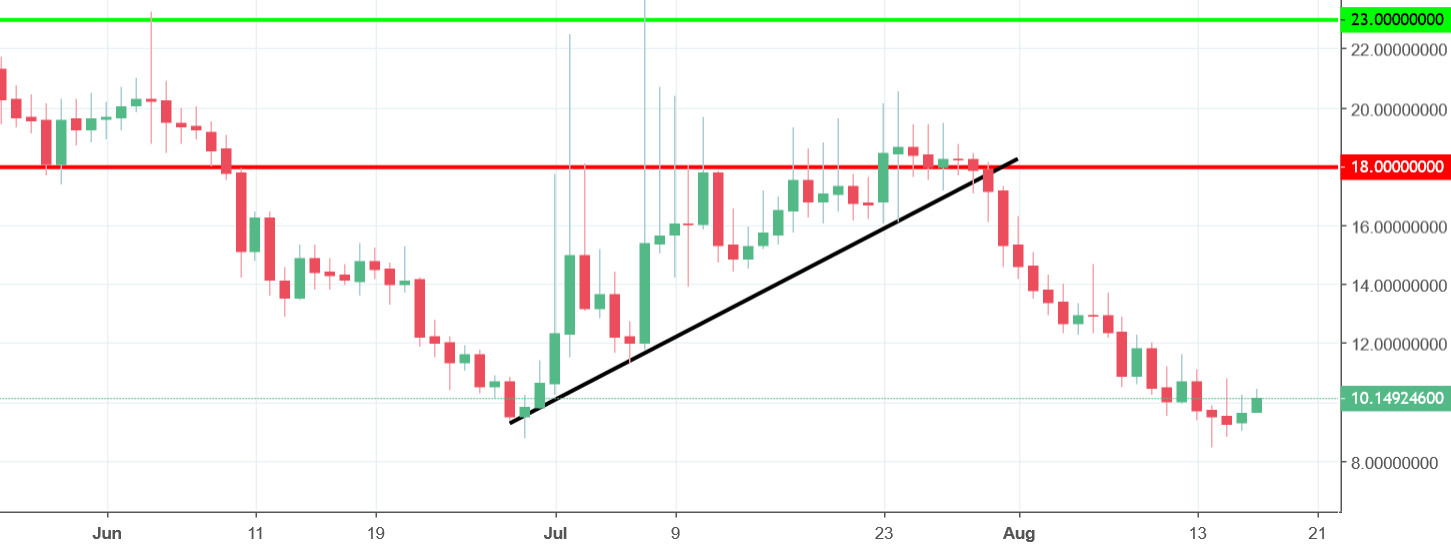
Since that, we had 17 trading days here and only 5 of them were positive (including today and yesterday). In slightly more than two weeks, the price fell to the support on the 8.6 USD created by the lows from the end of June.
Now, there is a time for reversal and BCD is up more than 6%. The place, where the upswing is happening can be and additional bullish factor here as the price can create a double bottom formation. Currently, the short-term sentiment is positive but as long, as we stay below the 18 USD, the long-term scenario is still negative.


Comments (0 comment(s))