Ontology Analysis – Pennant changes into an ascending triangle

The last piece today is Ontology, which is in the group of today’s biggest losers. We talked about this coin quite recently, exactly week ago, when the price was around 2.53 USD. We were bullish because of the one small technical pattern:
“Today, we mention this coin because the price is breaking the upper line of this pattern and is aiming higher. This breakout is a technical invitation to go long on this instrument. The potential target for this upswing is higher now and is the blue resistance on the 4 USD. Chances that we will get there are quite high. „
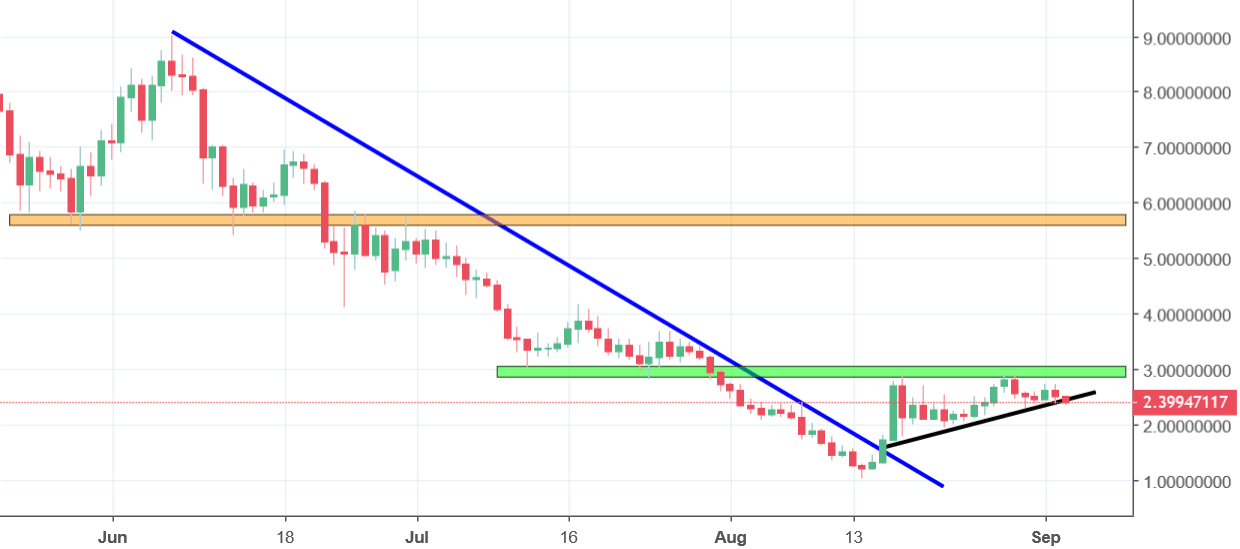
Yes, we aimed higher but that was a great signal only in the short term. Few days later, ONT reached the 2.8 USD, which as for now, it the most dangerous resistance. Today, we are down slightly more than 4% and the price is forming an ascending triangle pattern. That is generally positive but the thing is that we are very close to see the breakout of the lower line of this formation. Price closing a day below the black line will be a sell signal and the price closing a day above the green area will be a signal to go long.


Comments (0 comment(s))