ReddCoin Analysis – Demand gave up

Second analysis of the day will be about the ReddCoin and here, we will show you the power of the price action and patience. If you read us for some time, you probably got used to the fact that we often say that if the price will do x – buy and if the price will do y – sell. Why? Because sometimes, we need to see the breakout of important support or resistance first. Then we can think about opening a position. RDD was previously mentioned on the 21st of June and we said this:
“Positive scenario here is promoted by the fact, that the RDD broke the mid-term down trendline (orange).So far, it is too early to claim the bullish victory but buyers are very close to do that. All we need for a buy signal is the price closing above the red resistance. Positive sentiment will be denied, when the price will break the black line. „
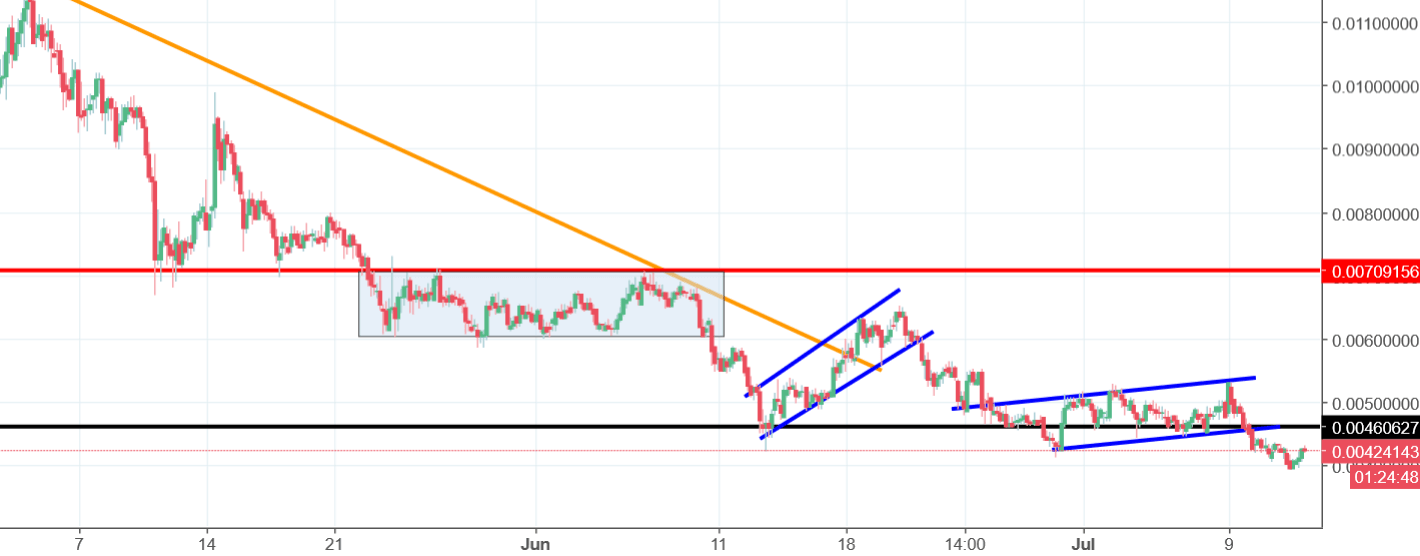
The price did not manage to break the resistance, so there was no buy signal. Instead of that, RDD went lower. In the meantime, ReddCoin created two trend continuation patterns, both of them were flags (blue) and resulted with the breakouts of the lower lines. Most recently, the price broke the lower black line, which kills the positive sentiment and opens us a way towards new lows. Today, we do have a small upswing but as long as we stay below the black line, traders should not think about buying.


Comments (0 comment(s))