USDJPY Technical Outlook
In the US, unemployment claims surprised by missing expectation for the first time in 10 weeks. A mixed outlook was drawn from the US construction data while manufacturing numbers were stronger than expected. The yen edged lower marginally in the moments preceding the release of US trade data as the market moved its focus to the US presidential election as we enter the home stretch.
Opinion polls hinted that Hillary Clinton will win the U.S. presidential race against Donald Trump and is now working on whittling down the Republican majorities in both houses of Congress. The U.S dollar index, which measures the greenback’s strength against a trade-weighted basket of six major currencies, was last quoted at 98.62.
Fundamentals
On Monday, euro zone members and the wider euro area are scheduled to release flash PMIs for October, New York Fed head William Dudley and St. Louis Fed chief James Bullard are also expected to speak within the same day. The dollar was also boosted as the euro faltered on the trail of Thursdays European Central Bank policy meeting. ECB President Mario Draghi indicated that the bank may extend it stimulus program in December.
The adjusted trade balance in the Japan for the month of September recorded a surplus of two billion yen, as exports edged lower by 10.4% year-on-year and imports plunged 16.6%. The yen fell marginally in the Asian trading session on Monday ahead of the trade data with markets sharpening the focus on the U.S. USDJPY traded at 103.97, up 0.18%.
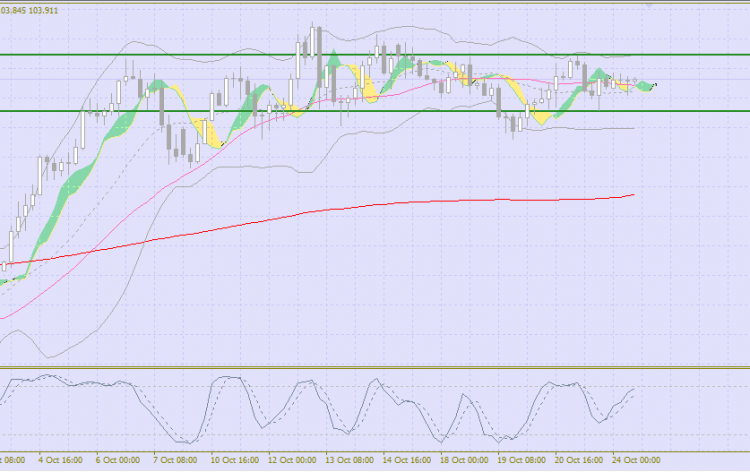
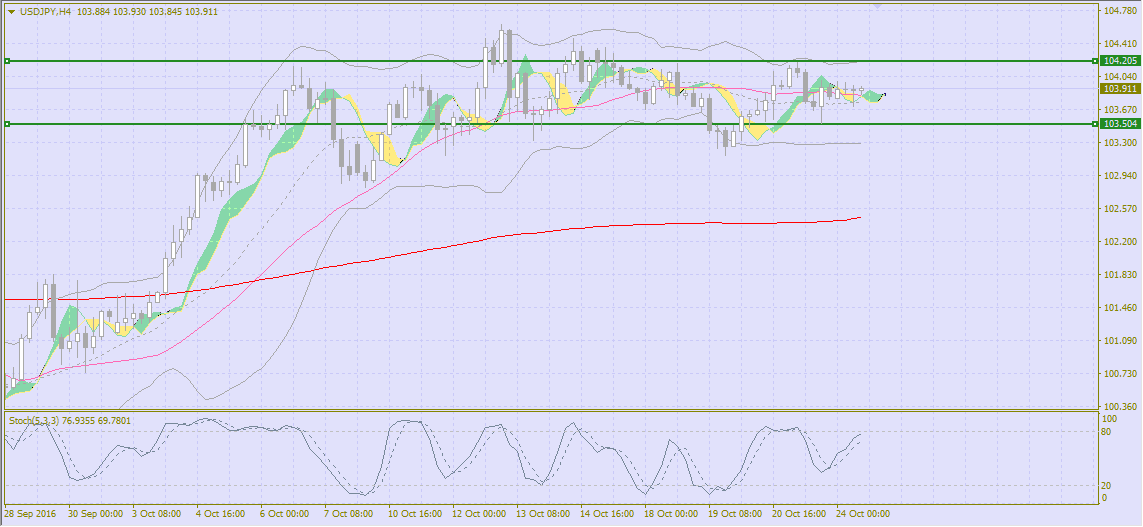
The price is testing the level 103.55 (23.6% correction) on the 4-hour chart, and in the event of a break below the 103.50 support level, there will be a fall that will likely go as low as 103.30; the lower line of Bollinger Bands and 102.90(38% correction, middle line of Bollinger Bands on D1). This is, however, the most feasible outcome with the Stochastic almost in the overbought zone. In an alternate scenario of a price reversal, the pair might rise to the level of 104.415 (The upper line of Bollinger Bands) and 104.64 (0.0% correction).
Support/Resistance Levels
Resistance: 104.20 (nearest level), 104.19 (maximum of 21st of October), 104.63 (maximum of 13th of October) and 105.00
Support:103.64 (the level was actively tested on Friday,21st of October), 103.23,103.00,102.80 (minimum of 10th of October), 102.45 ,102.26,102.00,101.83,101.50,101.20.
Trading Tips
After the price breaks down the level of 103.50 with the tangent in the area of 103.00, 102.80 and a stop loss at 103.80.
A Long position should be placed around 104.00 with targets at 103.00/102.80 and stop loss at 104.50 implementation period of 2-3days.


Comments (0 comment(s))