EOS Analysis – 7 USD resistance gone with the wind!
If you follow our forecasts, you can see that vast majority of them are spot on. It looks like we do have a crystal ball or something. To avoid those speculations, today we will analyse EOS, which we did already before, but surprisingly our view was wrong. In the piece from the 27th of March, we wrote that we should test the 4,8 USD support (lower blue). That was said when the price was around 5.5 USD. The lowest point we reached after that was the 5.15 USD on the 1st of April. Then, the price climbed higher.
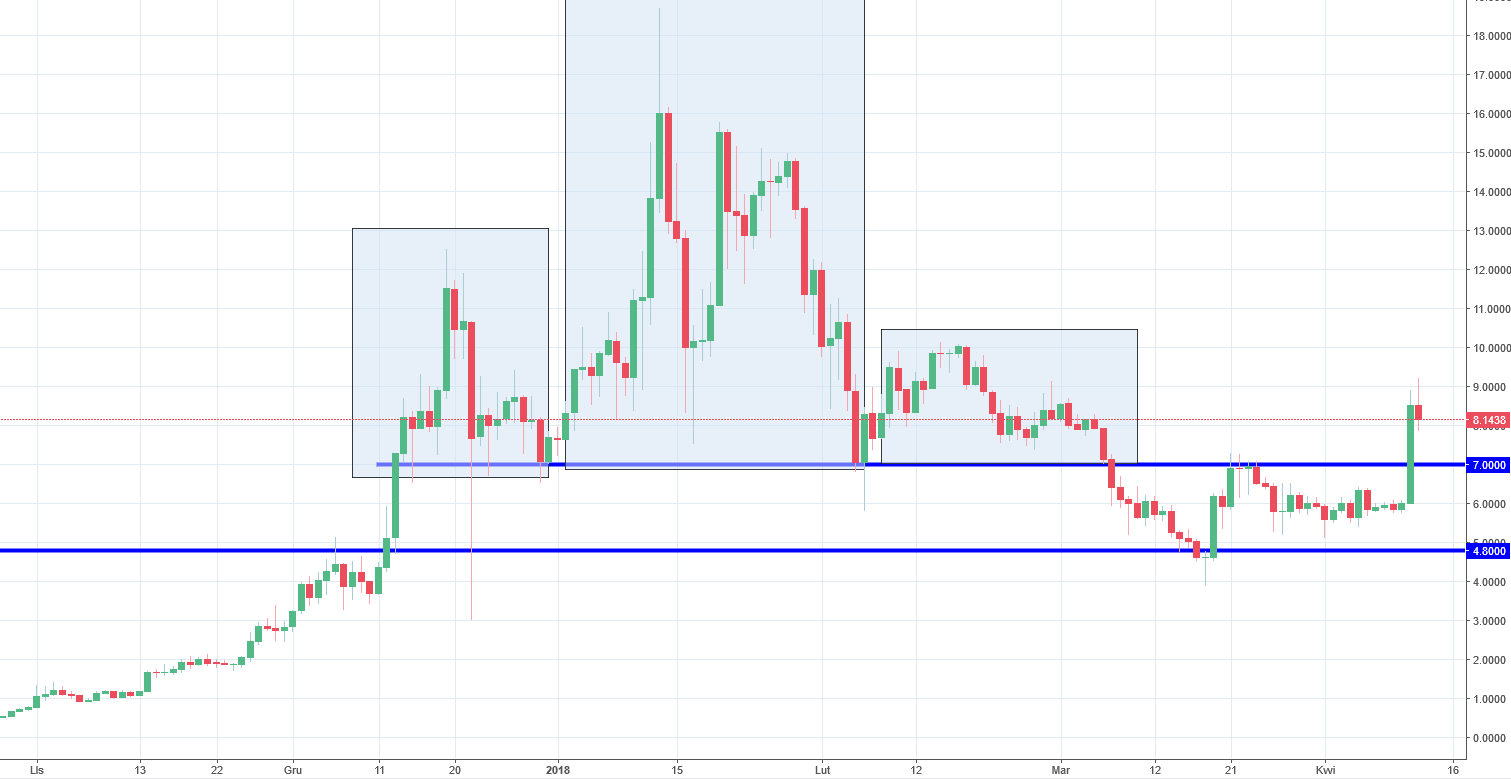
Yesterday, EOS had the best session since the 20th of January. One day was enough for the price to climb from the 6 USD to almost 8,5 USD. What is important here is that the price broke the resistance on the 7 USD (upper blue), which was a neckline of the head and shoulders formation, tested recently as a resistance. That triggers a buy signal here.
Today, we do have a confirmation. Although the price is falling almost 4% but the daily candle is still making higher highs and lows. That type of candle after the breakout, increases the chances for a further upswing. Our view stays bullish as long as we stay above the 4.8 USD support.


Comments (0 comment(s))