Bytecoin Analysis – Trendline is getting closer

If you follow us for some time, you should definitely know that we are mostly right here. At least 80% of our analysis are spot on. Time to deal with the one, where we were mistaken about the direction. I am talking here about the Bytecoin, which previously was mentioned here on the 4th of July and this is what we said back then:
“Currently, the sentiment is positive and we do have a legitimate buy signal as the price is moving very technically, which increases the significance of the recent movements. „
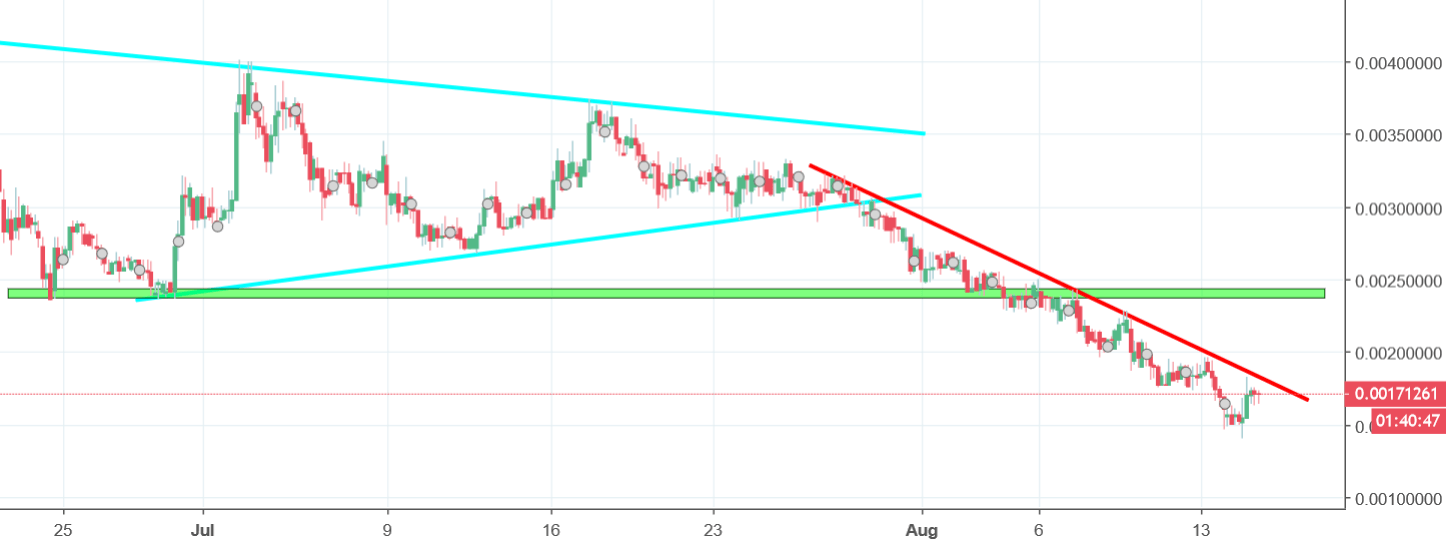
After this, the price did not go any higher. Instead of climbing up, the BCN created the symmetric triangle pattern (blue lines) and at the end of July, broke its lower line. That breakout was a direct signal to go short. The drop that happened afterwards was nice and technical. Sellers are still supported by the red down trendline. As long as the price stays below this line, we do have a sell signal. Breakout can be an occasion to buy BCN but chances for that are now rather limited.


Comments (0 comment(s))