Qtum Analysis – Nice reversal!

New week starts with the analysis of the Qtum, which for the last time was mentioned on the 3rd of August. Back in that day, we were bearish and we were expecting the further drop. Even despite the fact that we were already on the mid-term lows. On the 3rd of August, the price was around the 6.1 USD and we said this:
“Buyers do not even have power to test the recent support as a closest resistance. Sentiment is definitely negative and now is not the best time to own the Qtum. I do not even know if the time for that will eventually come. „
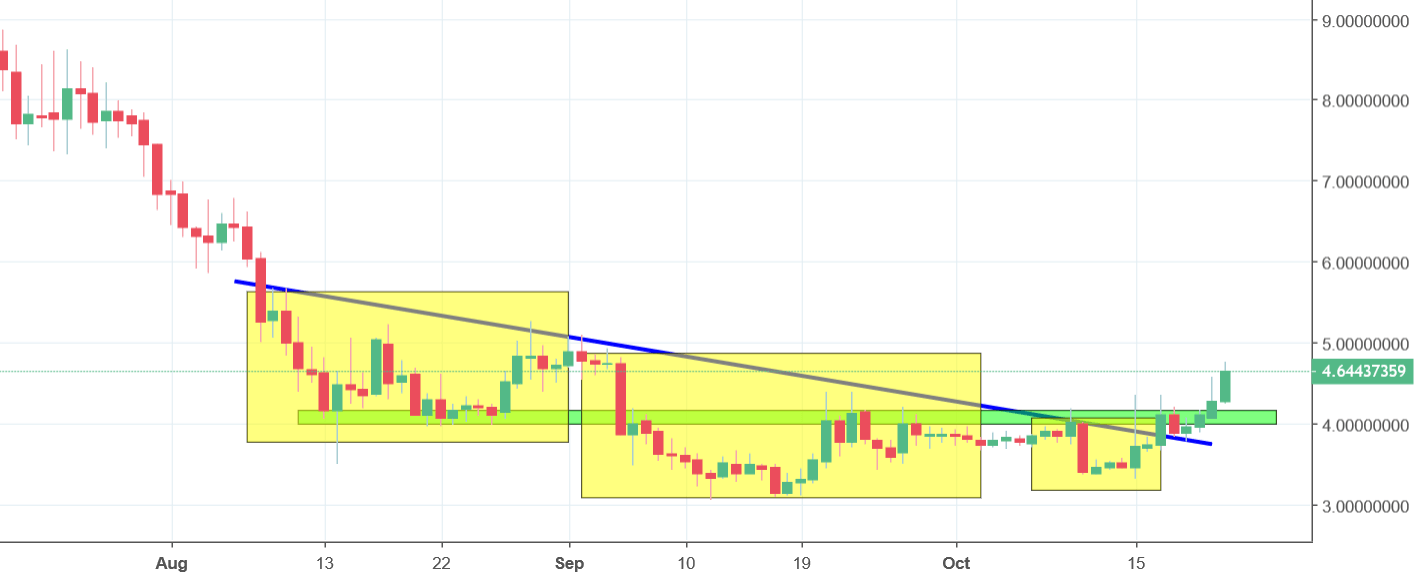
In the mid of August, we reached new lows around 3.11 USD. You have to admit that this was a great sell signal. Now, time for a reversal. Qtum created an inverse head and shoulders pattern and broke the neckline (blue). In addition to that, the price broke the horizontal resistance around the 4.1 USD (green), which most probably will be now the closest support. Qtum starts this week with a buy signal, being above two major supports. With this kind of setup, we do have high chances for a further surge. Buy signal will be cancelled, when the price will come back below the blue line, which as for now is less likely to happen.


Comments (0 comment(s))