Qtum Analysis – Broken 7,4 USD leaves no hopes

Second piece is about Qtum, which is not suffering such heavy losses as the Siacoin mentioned below but the situation here is equally negative. Previously, situation on the QTM was described by us on the 27th of June, when the price was around 8,7 USD. Back in that day we were bearish:
“Down trendline is not the only resistance here. We still have to remember about the 10 USD mentioned above. As long as the price is below that level, the sentiment is negative and we should see a further decline. „
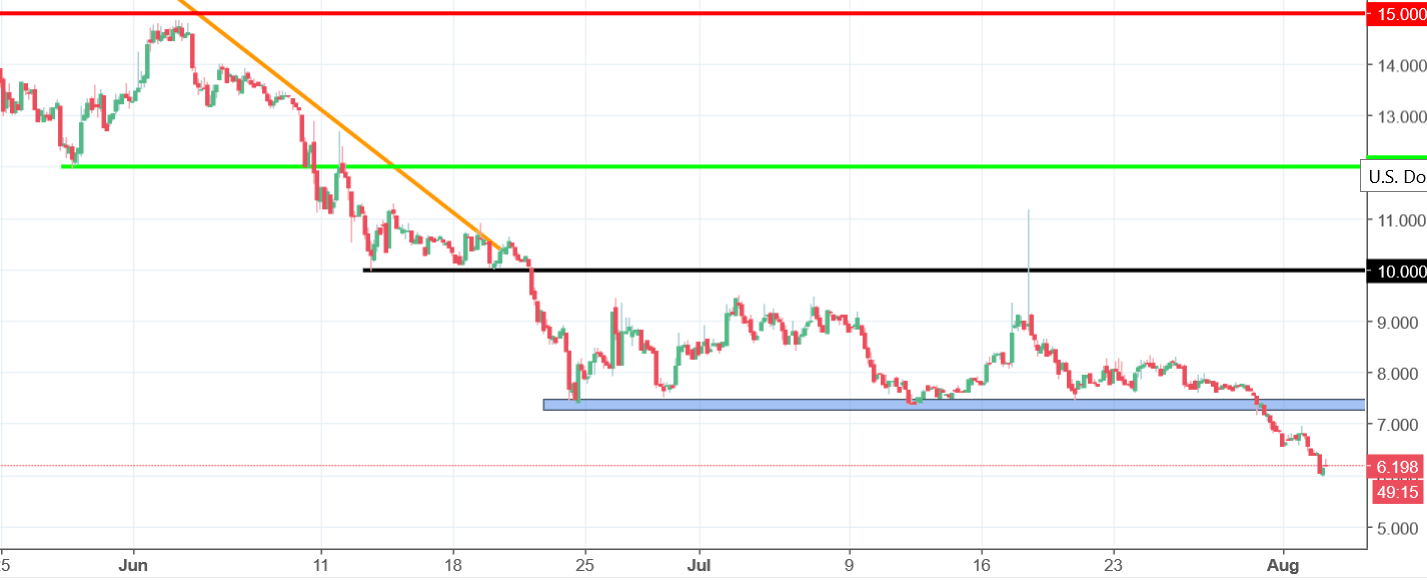
We were right. After that analysis was written, the price entered the sideways trend. 10 USD was tested as a resistance in the middle of July and the test was negative for the buyers, proving the bearish sentiment. At the beginning of this week, sellers managed to break the horizontal support on the 7.4 USD (blue), which is another bearish factor here pointing for a further drop. Buyers do not even have power to test the recent support as a closest resistance. Sentiment is definitely negative and now is not the best time to own the Qtum. I do not even know if the time for that will eventually come.


Comments (0 comment(s))