Qtum Analysis – Bullish correction towards the 10 USD resistance

Second piece of the day, will be Qtum, which previously was analysed by us, not so long ago – on the 20th of June. Back then, we were very pessimistic and we saw a great chance for a downswing, saying this:
“That support was broken and the QTM aimed another round level – on the 10 USD (black). As for now, that will be the closest support but the breakout looks imminent. The selling pressure rises and the sellers are additionally supported by the orange down trendline. Odds for the further drop are much higher. „
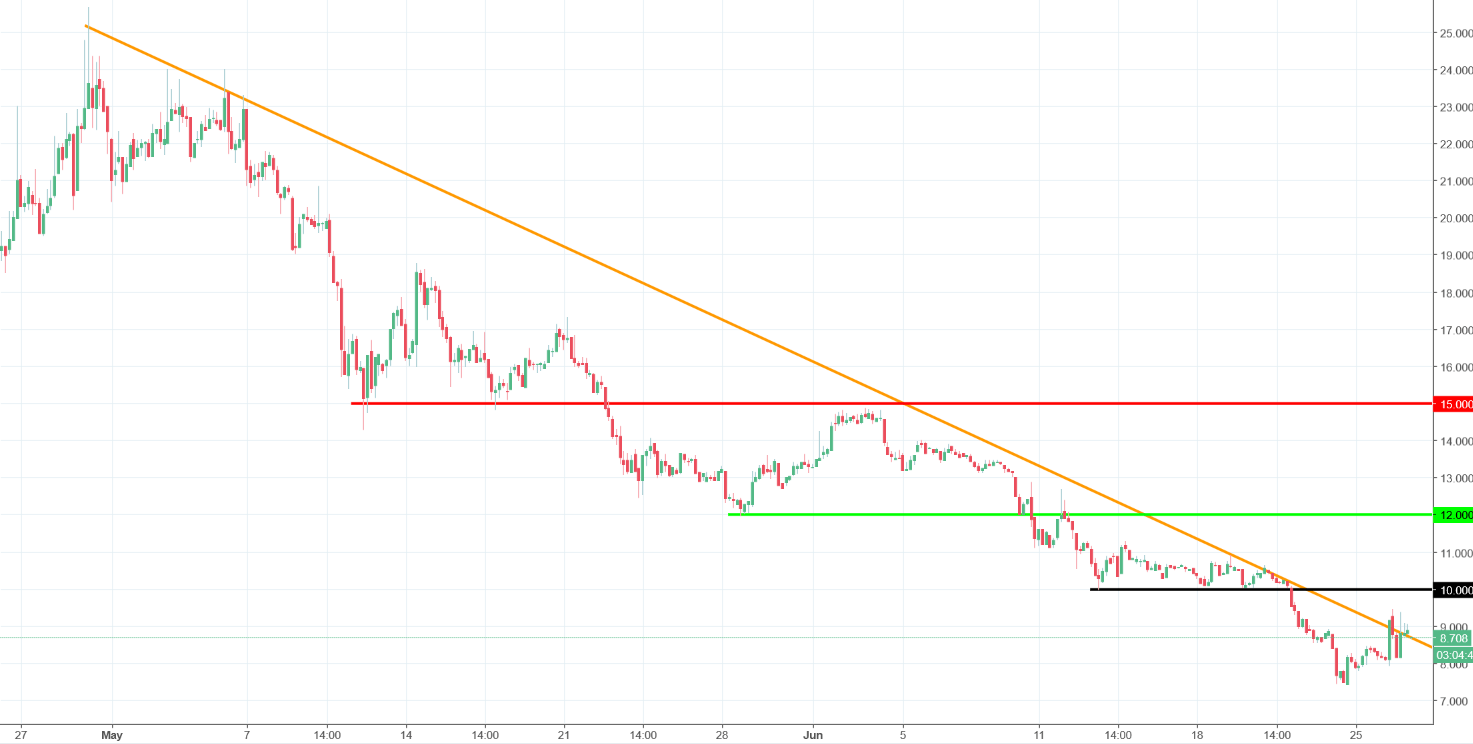
10 USD was broken two days later and after that, the price declined around 25%. You have to admit that it was quite a good call from our analytical team. Anyway, since the 24th of June, the QTM is in the bullish correction mode and the price is trying to break the orange down trendline. As for now, they are unsuccessful but the buying pressure is rising. Down trendline is not the only resistance here. We still have to remember about the 10 USD mentioned above. As long as the price is below that level, the sentiment is negative and we should see a further decline.


Comments (0 comment(s))