EURGBP Analysis – Nice sell signal!
Forex section in our technical analysis opens the EURGBP, where we are very close to another proper sell signal. As always, I have to mention the previous piece about this instrument and today I am doing that with extra pleasure as that was a technical masterpiece! For the last time, we were talking about the EURGBP on the 10th of October and we saw a chance for a bullish correction:
“Bears are fully controlling the situation. But wait, after such a strong drop, we need to see some kind of a bullish correction. This one is probable but should be a normal take profit action. Sell signal is on as long as we stay below the blue horizontal resistance. „
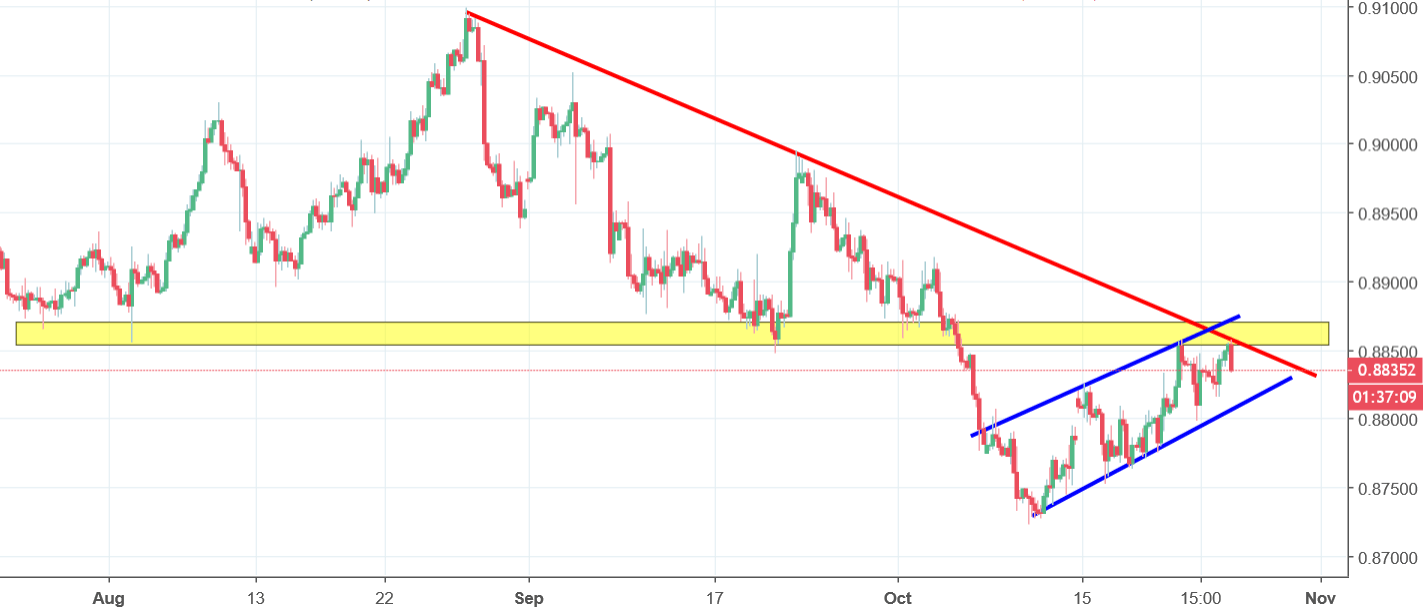
This is precisely what happened. The price made a bullish correction and went higher creating a flag pattern (blue). Flag ended on the horizontal resistance (yellow) and the dynamic down trendline (red) creating a double top formation. That is a super strong sell signal. With this kind of a price action we should definitely go lower in the next few weeks. Sell signal is on, as long as we stay below the yellow resistance.


Comments (0 comment(s))