EURGBP Analysis – Broken long-term up trendline
Today, I will also show You the situation on the EURGBP, which falling down like a rock. This drop was not expected by us. In our previous piece, from the 3rd of October, we were bullish as the price was bouncing from the horizontal support. Luckily, we gave you an exact place, where this bullish sentiment could have been denied:
“When this breakout comes together with a bounce from a horizontal support – we do have a proper buy signal. Positive sentiment will be denied, when the price will come back below the green area but that is less probable at the moment. „
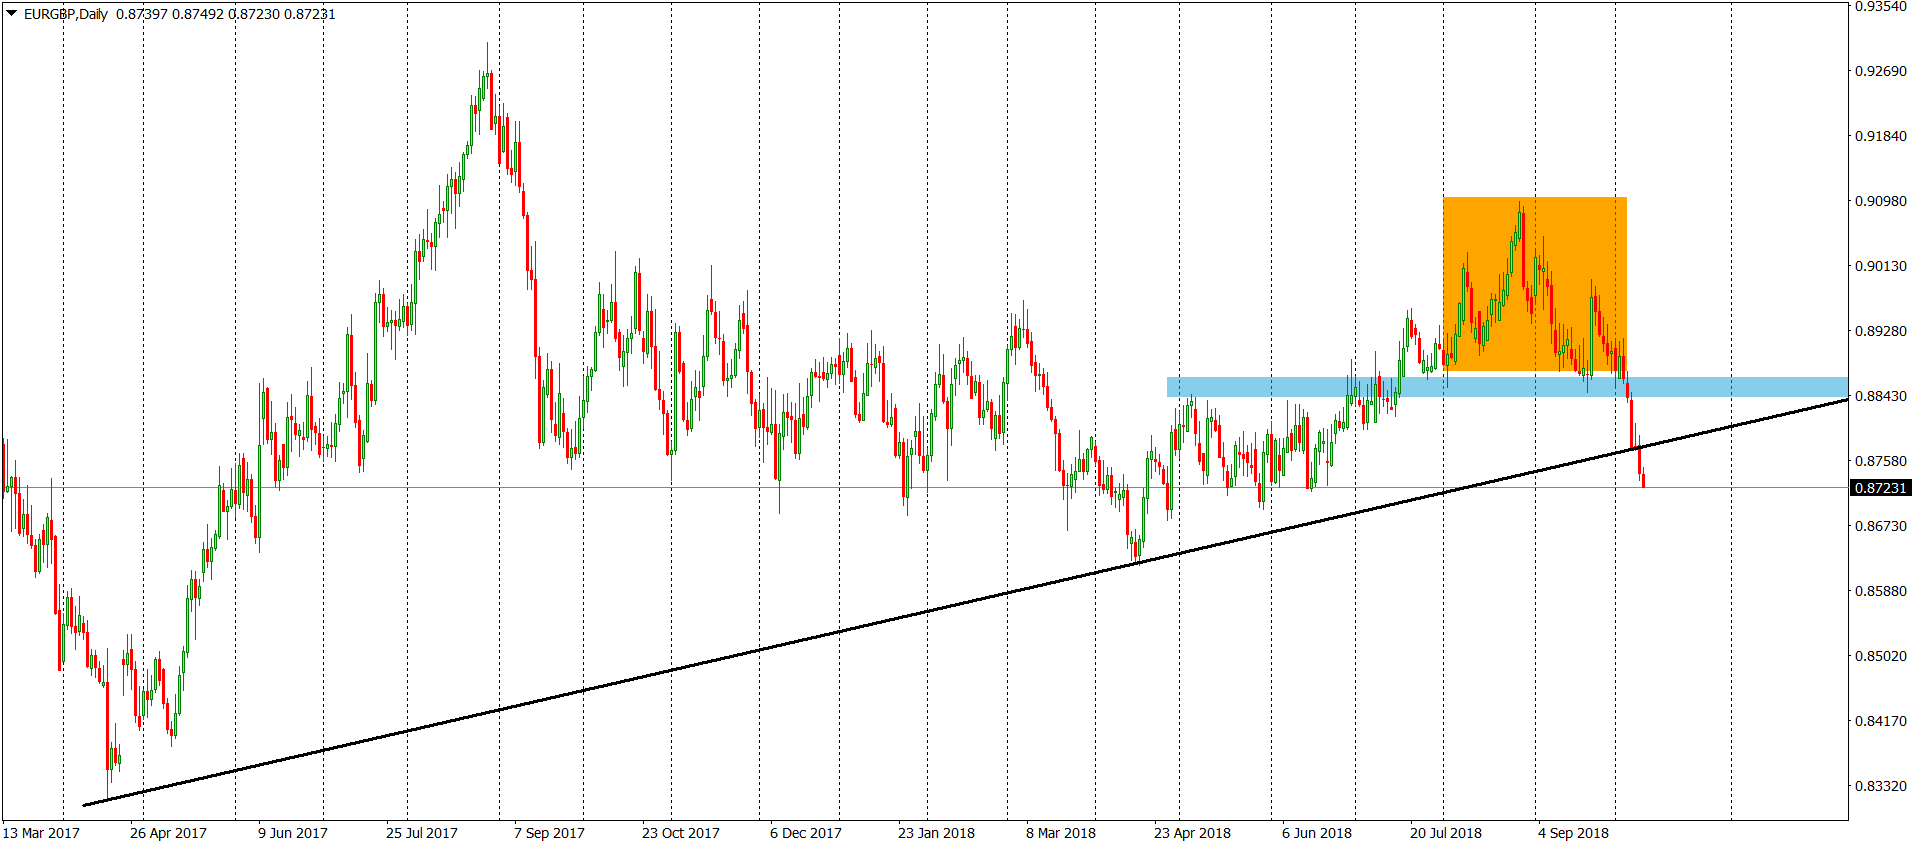
The price broke that support with ease, triggering a sell signal. In the next few days, the price was going sharply down and yesterday, managed to break the long-term up trendline (black). That breakout sorts out the situation here, we can all go home. Bears are fully controlling the situation. But wait, after such a strong drop, we need to see some kind of a bullish correction. This one is probable but should be a normal take profit action. Sell signal is on as long as we stay below the blue horizontal resistance.


Comments (0 comment(s))