EURUSD Analysis – Potential reversal

Now, time for the EURUSD, so the main pair on the market. For the last time, we talked about this pair on the 19th of October, when the price was testing the local support around the 1.144. Back in that day, we were quite pessimistic and our outlook was that this area should be eventually broken:
“The price broke the yellow horizontal support and is currently testing the long-term lows marked with a blue colour. The bearish momentum is strong and so far, the bounce is very weak. This may indicate that the buyers left the market and the sellers should take the control over soon. Breakout to the downside is very probable and this is our outlook for this instrument. „
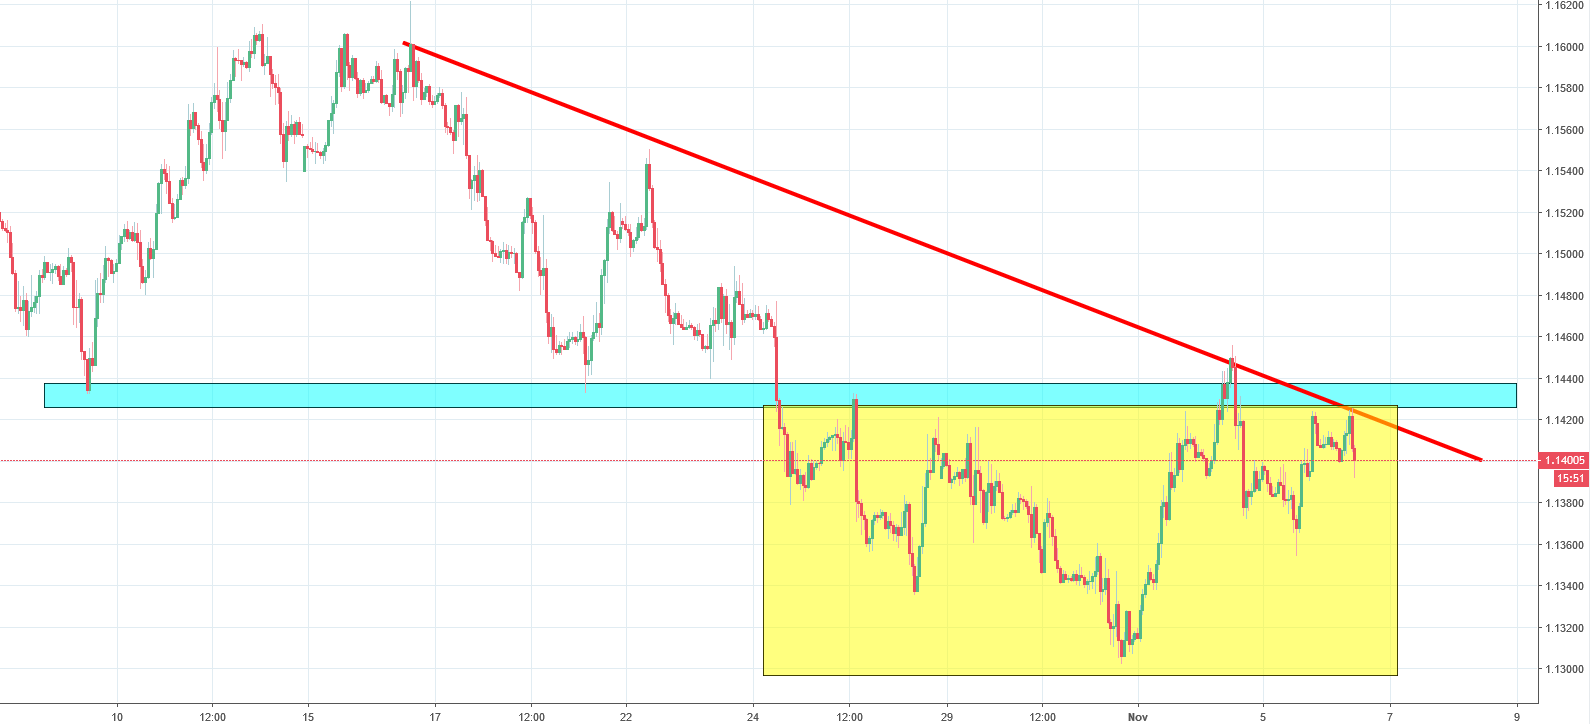
We were right. The breakout happened on the 24th of October and the price managed to set the new mid-term lows on the last day of the month. Since that we do have a reversal. It is not an ordinary bounce, the price is creating an inverse head and shoulders pattern (yellow). Previous support (blue) is now the closest resistance (and the neckline!). Price closing a day above that area will give us a proper buy signal. This bullish scenario will be additionally strengthened by the breakout of the red mid-term down trendline.


Comments (0 comment(s))