What is the Accelerator Oscillator indicator?
The problem with the Forex industry (which is not really a problem, more of a lot of work) is the fact that there are so many topics of varying complexity that a trader needs to learn about before they become effective at their jobs. All the concepts that beginners need to know before they start trading might be the reason why so many of them quite early in the game. One of the more elusive concepts is the Accelerator Oscillator indicator, how it works, what it does and why you should be using one. It is most elusive because it is a very brief subject and a rather basic one. This causes a lot of educational sources to disregard the subject. We are here to help the beginners, which is why we are going to be explaining even this rather small subject in great detail. We are going to discuss what it is, how you can use it and how to devise strategies around it in a way that will allow you to achieve maximum success while trading. We will also talk about how this indicator compares to some of the others, such as the RSI indicator and the ADX indicator. By the end of the article, you should have a good understanding of the concept.
Accelerator Oscillator FX indicator
The full name of the indicator is the Acceleration/Deceleration Technical Indicator or AC in short. This, just like any other indicator, attempts to predict the changes in the market and provide sell or buy signals before the price changes start happening. The Acceleration/Deceleration Technical Indicator might be the most basic out of all of the indicators that a trading platform might offer you, but it is also one you should learn how to use the earliest. It is the easiest and one of the useful indicators you will pick up at any point. Understanding market driving forces and the directional changes of these forces will allow you to alter your strategies and work towards better trading. The AC will allow you to see how fast the current driving force is accelerating and decelerating by providing you with two “lines” indicating” the directional changes of the market forces. This allows you to create an accelerator oscillator trading strategy, that can be used to maximize profits.
So how do you use it?
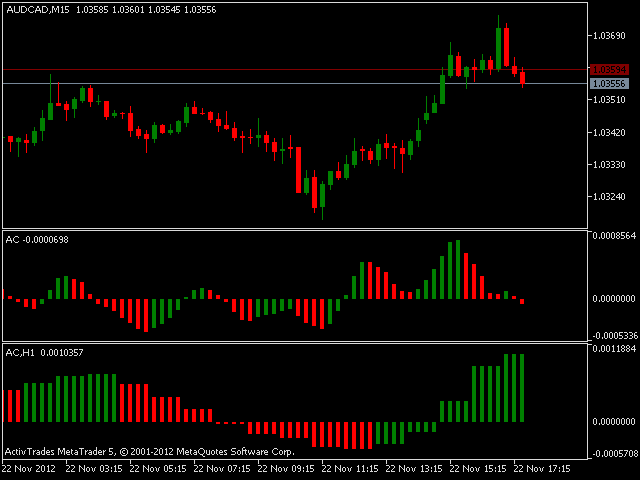
To use the accelerator oscillator chart, you need to understand how it works, which is a rather simple thing to do. You do not need to keep track of any lines or do any complex calculations. What you do need to do is keep track of the colours that are given to you on the chart. The two are green and red and are well representative of the acceleration deceleration oscillator and what information it provides. You see, when the colour of the chart is red, that means that the market forces on an asset or a currency are decelerating and you should not buy that specific stock. When the colour of the chart (or column if that is what you prefer to call it) is green, you should not sell. While these two seem to be arbitrary rules, again, the deceleration and acceleration of the market forces are what we are looking at. If the market forces are decelerating it means that the specific asset is going to start losing value pretty soon. This means purchasing the asset will result in a loss because the prices will soon be dropping. The opposite is true for the green coloured column.
To go in a bit deeper into the basis of the acceleration oscillator indicator rules and attempt to understand the basis for them, you need to know one thing. The indicator is measured against the nought line, the zero point line. If the accelerator indicator is above this line than the columns will be shown to be green because of the market forces currently being positive on the asset. When the indicator falls below the nought line, this means that the market forces are decelerating, turning the column red and causing you to expect a fall in the prices of the asset. The idea is pretty simplistic and rather useful. Though you should not use the indicator as a buy or sell signal on its own. Use it as a don’t buy or don’t sell signal. If you want to get buy and sell signals from your indicator, you should consider using it in conjunction with a number of other indicators. Multiple sources of information are more useful than a single one when considering how to handle a market situation. The fact that it is not used as a buy or a sell signal source is what makes accelerator oscillator vs awesome oscillator difference so important.
Calculation
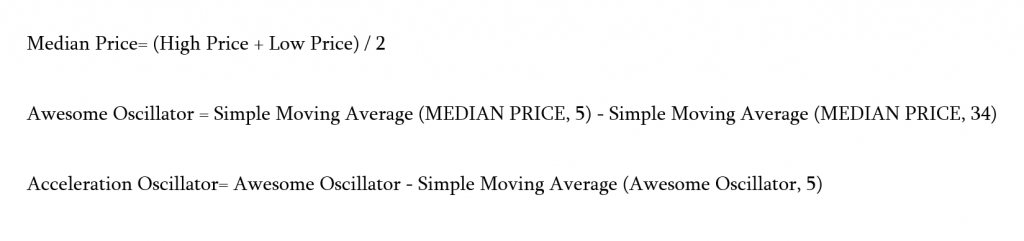
The calculation behind the accelerator oscillator s pretty simple. While you might not be a mathematician or might not even be interested in how it’s done, we are still going to provide you with some detail about it, since it might be of use in your process of understanding the concepts slightly better. The first step is determining the median price, which is a simple division of the sum of the high and low prices of the asset in two. Next comes the calculation of the Awesome Oscillator, which is a subtraction of the Simple moving average Median Price 34 from the Simple Moving Average Median Price 5. Finally, to calculate the Acceleration Oscillator, we Simple moving average AO 5 from the AO itself. The result is the value of the accelerator oscillator what determines colour change, and allows you to make the right decision relative to the forces currently dominating the market.
Where it came from
Now that you understand the basics of how to use accelerator oscillator indicator, you might want to learn where it came from and why you might want to consider using it. The creator of this indicator, as well as of a number of other important indicators in the industry, was Bill Williams. The man is a sort of a legend among traders and is among some of the most successful traders in the world. Born in the 1930s (he is very old) he has spent years working in the trading industry and developing theories to try and contextualize the markets and forces driving them. He has worked with the chaos theory, technical analysis and has developed a slew of indicators to try and predict market attitudes. He is also the man who developed the AC indicator, which is why you should definitely consider using it. According to the man himself, the accelerator indicator is the earliest possible predictor of market forces and trader attitudes. Using it will grant a smart trader an edge over the others that cannot be simply ignored. Bill Williams is a deeply respected professional in the field, with years of experience in stock, commodity and Forex trading. his opinions are highly regarded among all traders and, if you intend to be one, you should definitely consider learning more about him.
We have said this many times, studying up is one of the key things to do if you wish to become a successful Forex broker. While learning about the AC indicator might seem sufficient, it might be a good idea to take a deeper look at the accelerator oscillator Bill Williams stockcharts and at his literature as a way of learning more about markets, theories about the driving forces behind them, and other details that might be interesting to a trader. Creating a theoretical understanding and contextualizing what you are doing with a general understanding of the market mi provide you with an edge that other traders do not have available to them.
How to enable AC indicator on Metatrader 4
After having gained this much information about the accelerator oscillator indicator, you might want to figure out a way to actually start applying it to your work. The only way to do this is to enable to AC indicator on your MetaTrader 4 or 5 account if you have it. If you have a different type of Forex platform, you might have to go about enabling it a different way, but it should be available to you on the platform itself.
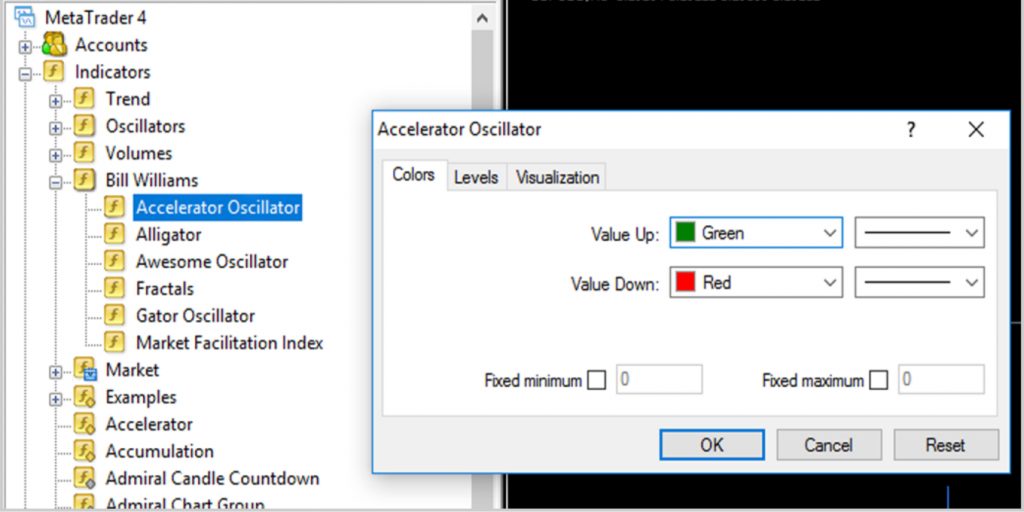
MetaTrade 4 categorizes different indicators into four categories. The category you are looking for is the Bill Williams one. The fact that there is an entire category dedicated to him should already tip you off to the fact that it might be a good idea to keep track of at least one of those indicators and that you might want to take a better look at Bill Williams, overall. What you are looking for in this category is the Accelerator Indicator. Selecting it and you will get a pop-up window allowing you to set colours to the columns of the indicator. Select OK and there you go, now you have access to the accelerator indicator. Keep a close eye on it, as it will offer you early signs of what the next best step for you might be.
So far, this is all you need to know about the AC indicator. Hopefully, the information provided above will give you enough knowledge to get you interested in working with the indicator. It is one of the most important and versatile indicators that you could ever use in your work on the Forex market. The fact that use for the accelerator oscillator crypto, stock and commodity versions are all used by traders should be a sign for you to start using it as well. Good luck!


Comments (0 comment(s))