Aeternity Analysis – Triangle and H&S formation point south
Crypto market is quiet at the very beginning of the European session. That can be a calm session ahead but we found 3 interesting setups for you, which may bring some action to this market. First one will be Aeternity, previously mentioned by us on the 25th of June, where we were optimistic in the short-term but we kept our negative view in the long-term. Back in that day, the price was around the 1.85 USD and let’s see how this worked out for us:
„To wrap things up: our short-term sentiment is positive and we see quite big chances of the price testing the 2.5 USD resistance. In the long-term, sellers are still winning and we should see a further decline towards the red support, around the 1.26 USD. „
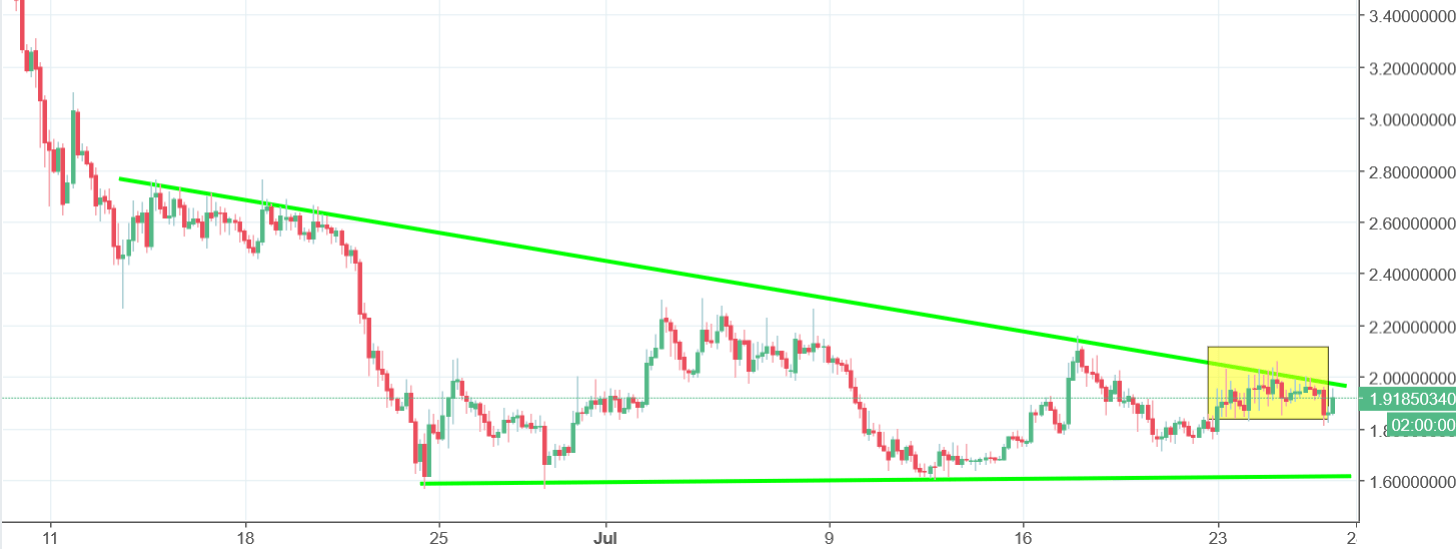
After those words were written, the price aimed higher and on the beginning of the July reached the local tops on the 2.3 USD, so almost there. Since that, the price entered the sideways trend locked inside of the descending triangle pattern (green). This formation promotes a further drop, especially that recent bounce from the upper line ended with a head and shoulders pattern (yellow rectangle). Today we are climbing higher but there is no buy signal yet. The positive sentiment will be triggered, when the price will break the upper line of this formation. Other than that, we should continue to aim south.


Comments (0 comment(s))