Ark Analysis – All eyes on the 0.8 USD

Second week of July finishes with another first timer here – Ark. On this crypto, we do have one dominant bearish formation on the long-term daily chart, which basically kills any bullish dream here.
During past several months, Ark draw a huge head and shoulders pattern on the chart (grey), which is one of the most popular negative formations in trading. To trade this pattern, you need to wait for the price to break the neckline, so the support connecting bottom of the head and shoulders. In this case, the neckline is the green horizontal support around the 1.76 USD.
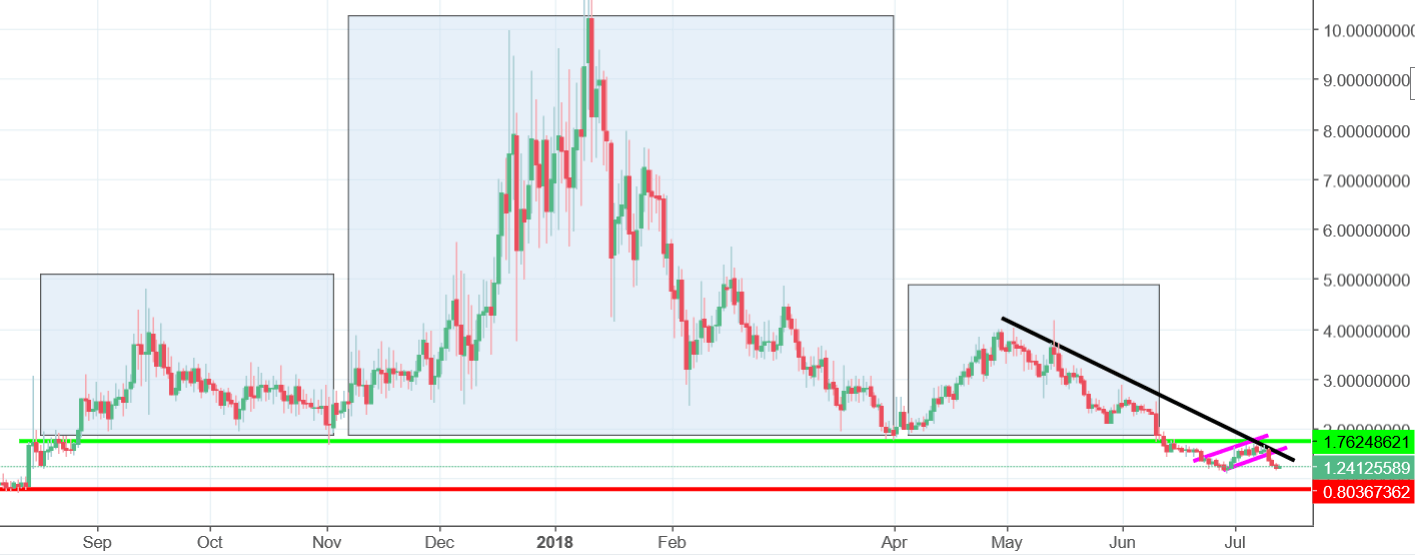
The neckline was broken on the 11th of June. What is more, it was already tested as a resistance on the 8th of July and the test, resulted with the bounce. In the meantime, we also created a flag (pink) and bounced from the mid-term down trendline (black). All of those elements are negative and are supporting a further drop.
The current target is on the 0.8 USD, so on the lows from the beginning of August and chances that we will get there are pretty high.


Comments (0 comment(s))