Augur (REP) Analysis – Third pattern in a row
Second hero of the day will be a newbie – Augur, so this will be the first time that we will be writing a piece about this crypto. Movements here are rapid and volatile. Candle Chart has a lot of gaps and is not very smooth. Despite that, price swings are pretty technical and in the past few weeks, REP created three technical patterns!
First one was the head and shoulders pattern (yellow), which was a bearish pattern and the breakout of the neckline, gave us a sell signal. Second one was a very technical flag (blue lines), which was a perfect trend continuation pattern and resulted in a further downswing. The last one, third, was also a flag but slightly bigger (black lines). No surprise here too and the price broke the lower line of this pattern and aimed lower.
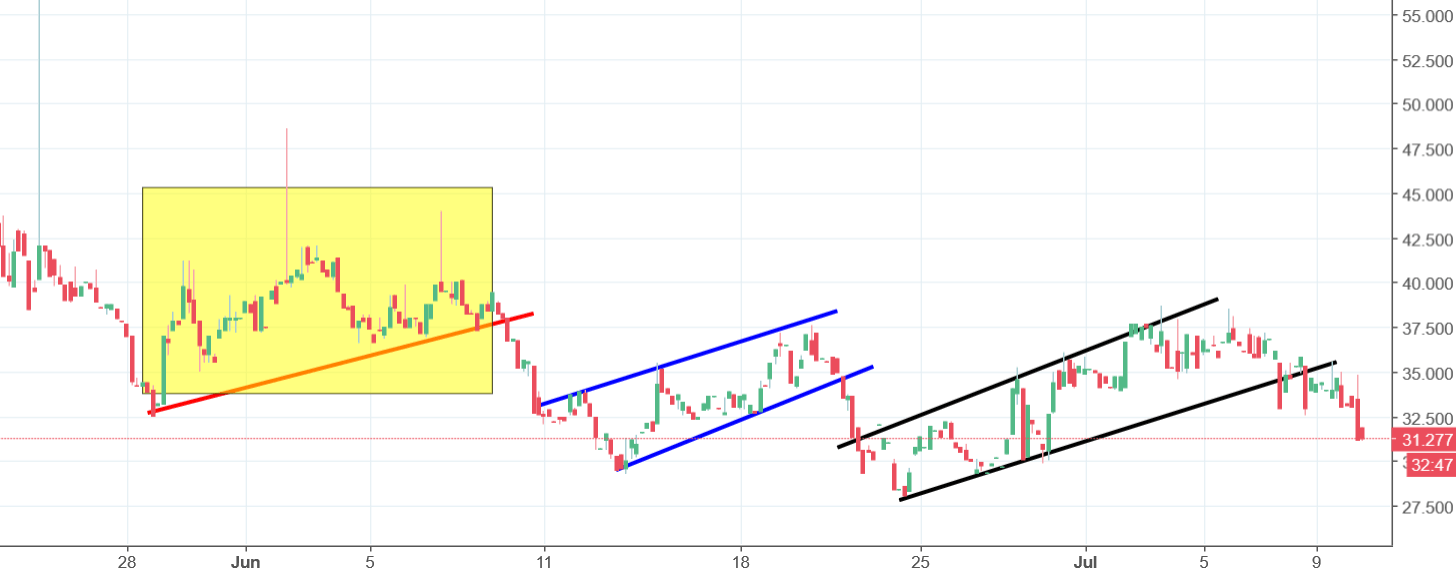
Breakout of the lower line of the flag, gave us a fresh sell signal and this is our outlook on this altcoin. Negative signal will be cancelled, when the price will come back above the highs from the beginning of June.


Comments (0 comment(s))