Bitcoin SV Analysis – Broken triangle and a buy signal

Time to analyze Bitcoin SV, so a new Bitcoin created after another hard fork, this time hard fork on the Bitcoin Cash. Many traders had big hopes about this project but I bet that the recent price movements do not keep them satisfied.
Since the 17th of November, till yesterday, the price was closed inside of the symmetric triangle pattern (black lines). This formation shows us a decreasing range and volatility. The way how you trade this is to wait for the breakout. If the price breaks the upper line, that is a buy signal, if the price breaks the lower line, that gives you a sell signal. In our case, yesterday, the price broke the upper line of this formation. What is more, BSV broke the horizontal resistance from the 26th of November and 7th of December (red). That can be perceived as an additional bullish factor.
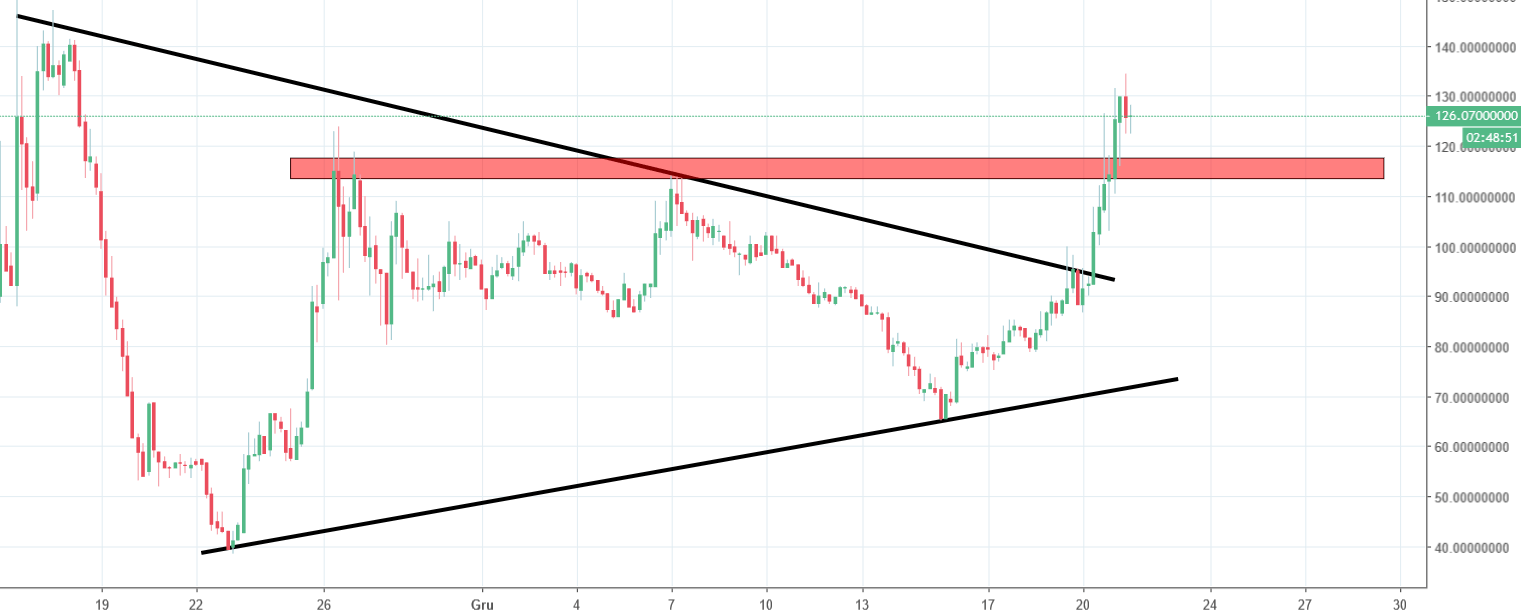
Friday ends with the small reversal and the test of the recent resistance as a closest support. As long as we stay above the red area, the signal to go long is alive. Price coming back below will mean a false breakout and will be a legitimate signal to go short.


Comments (0 comment(s))