Civic Analysis – Long-term triangle is coming to an end

The second piece of the day will be about the CVC – Civic and we will also analyse this crypto against the Bitcoin. Here, we are waiting for a proper trading signal but we should have a final result soon.
Since the October 2017, the pair is in the long-term symmetric triangle pattern. This kind of formation can be bullish or bearish. You may be wondering what is the usage of this for the technical traders? Well, you just have to wait for the breakout. When the price is inside of this pattern you should not predict the direction but you should patiently wait for the breakout and trade it, once you will get the confirmation.
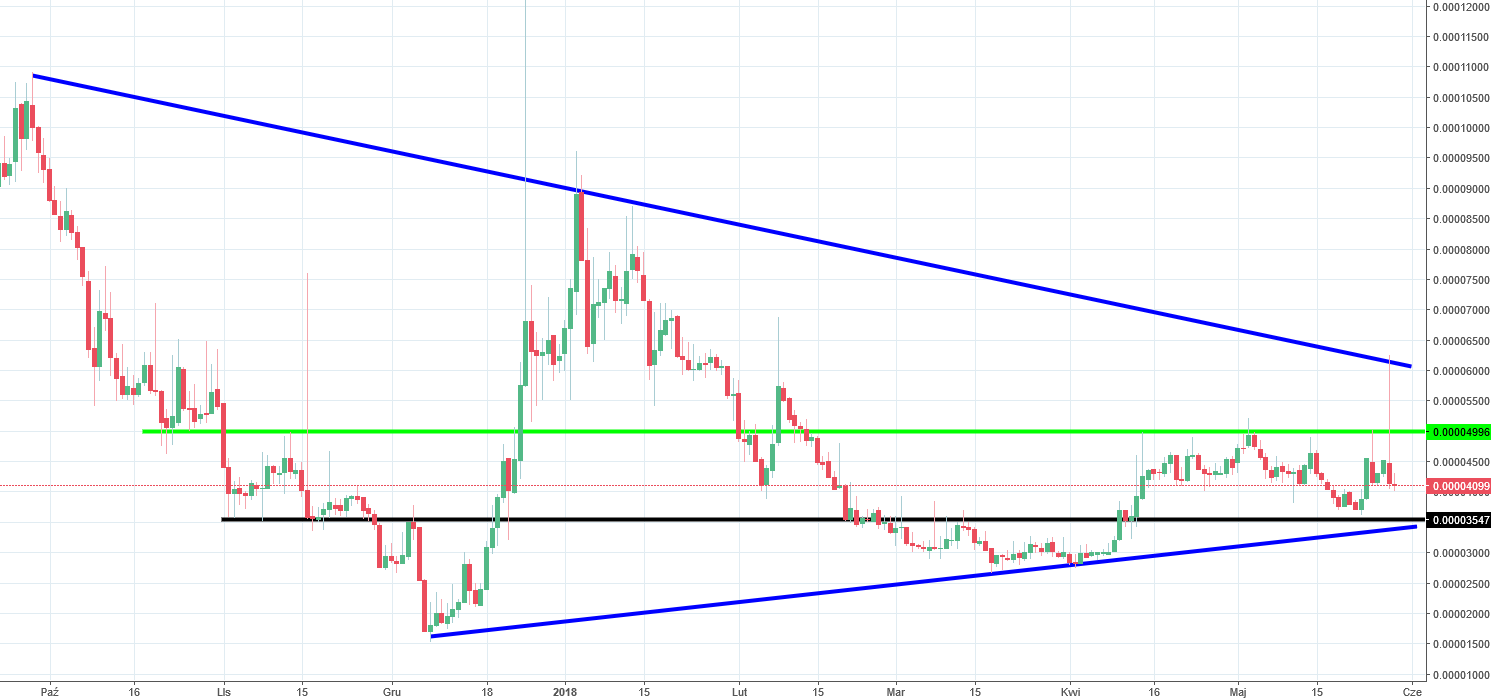
Current situation looks more bearish, so there are more chances for the drop, especially after the candle from yesterday, which has a long head and touches the upper line of the triangle. This shows us the rejection of the higher levels and a willingness to go lower. Before opening the short position you should wait for the breakout of those two: lower line of the triangle but also the horizontal support market with a black line.


Comments (0 comment(s))