Ethereum Analysis – To the moon! (NOT)

That is a real bloodbath on the market. This is how it ends, when inexperienced traders jump into the bubble market. All those who bought the cryptos in their prime are now selling their assets. May of those people were buying with the borrowed money. Oh dear, definitely not the position I would like to be in right now. Obviously counter to that, you will get many memes: HODL, when the moon etc but it is all getting funny. Hard facts and numbers against the hope drawn in memes. Anyway, let me show You the situation on the Ethereum, which is now one of the biggest losers among the biggest cryptos.
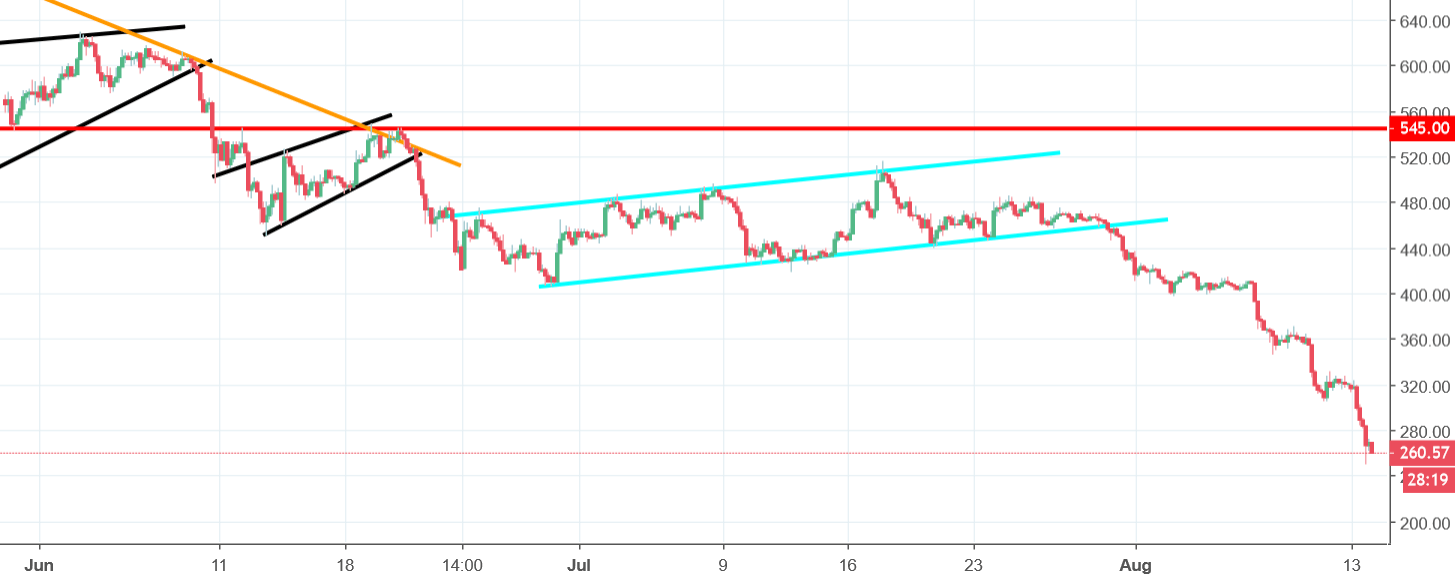
Previously we mentioned the ETH on the 22nd of June, when the price was around the 476 USD. We were saying this:
“The signal to go short is on and will be denied only when the price will come back above the trendline, which for now, is less likely to happen. „
Now, we are on the 261 USD and we just beat the lows from October and November 2017. How far we can go? Well, to the moon! This answer was very popular at the end of the last year but is kind of a joke right now. Let’s get down on earth. The recent drop is so strong that some kind of reversal and a pull-back is needed but the overall long-term sentiment remains negative and the ETH should be much weaker in the next few months.


Comments (0 comment(s))