Polymath Analysis – End of the bullish correction

First analysis of the day and we have a newbie on our website – Polymath, so this will be the first time that we will be writing about this crypto. Here, since the beginning of June, we do have a strong decline and the price lost around half of its value.
End of June and the first week of July were positive though. The price entered the bullish correction, which was shaped like a flag (blue). Flag managed to drive the price towards the resistance around the 0.42 USD (yellow) and this is where buyers lost their momentum. In addition to that, the price created a head and shoulders pattern (grey rectangles). This is a bearish pattern, that, together with the flag, promotes the further drop.
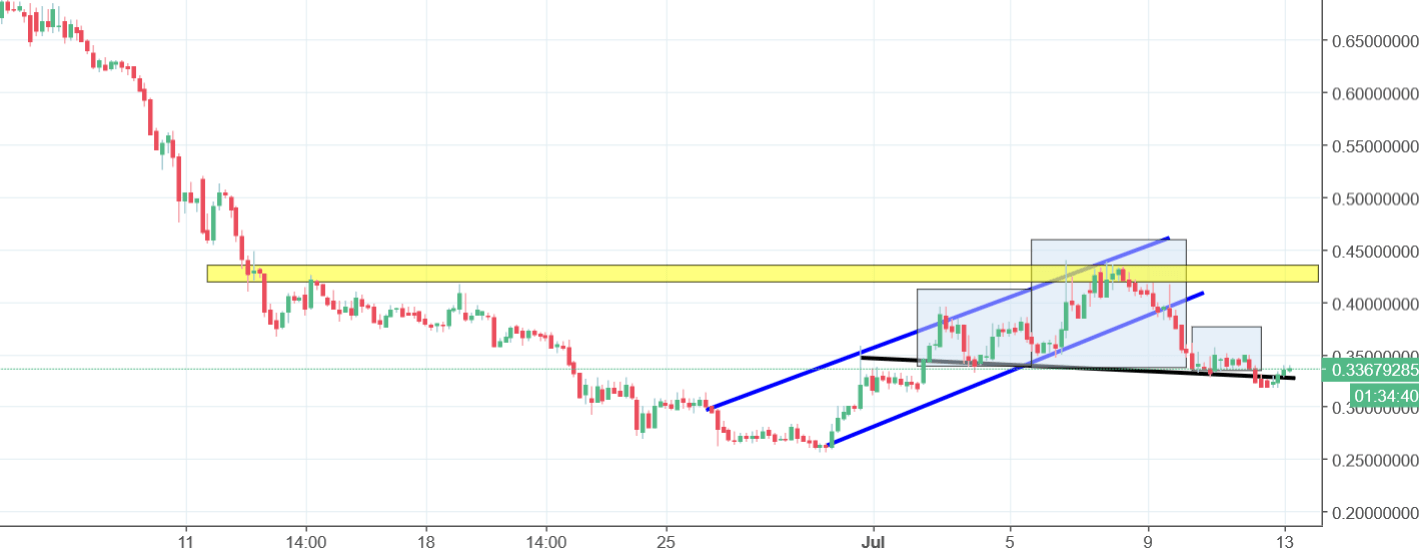
As for the sell signal, we are having it as we speak. The price is now breaking the neckline (black) and the POLY closing below the black line will be a strong signal to go short.


Comments (0 comment(s))