Pundi X Analysis – All time lows

This week ends for us with the splendid analysis of the Pundi X, which was previously mentioned here in the last day of October. Back in that day, we were bearish, focusing on the flag formation, which was being drawn on the chart:
“First one resulted with a bearish breakout and we think that the second one will end in this style too. Today, the price is going down almost 8%, which can be an initiation of a new drop. The sell signal will be triggered, when the price will break the lower line of the flag and to be honest with you, that can happen soon. „
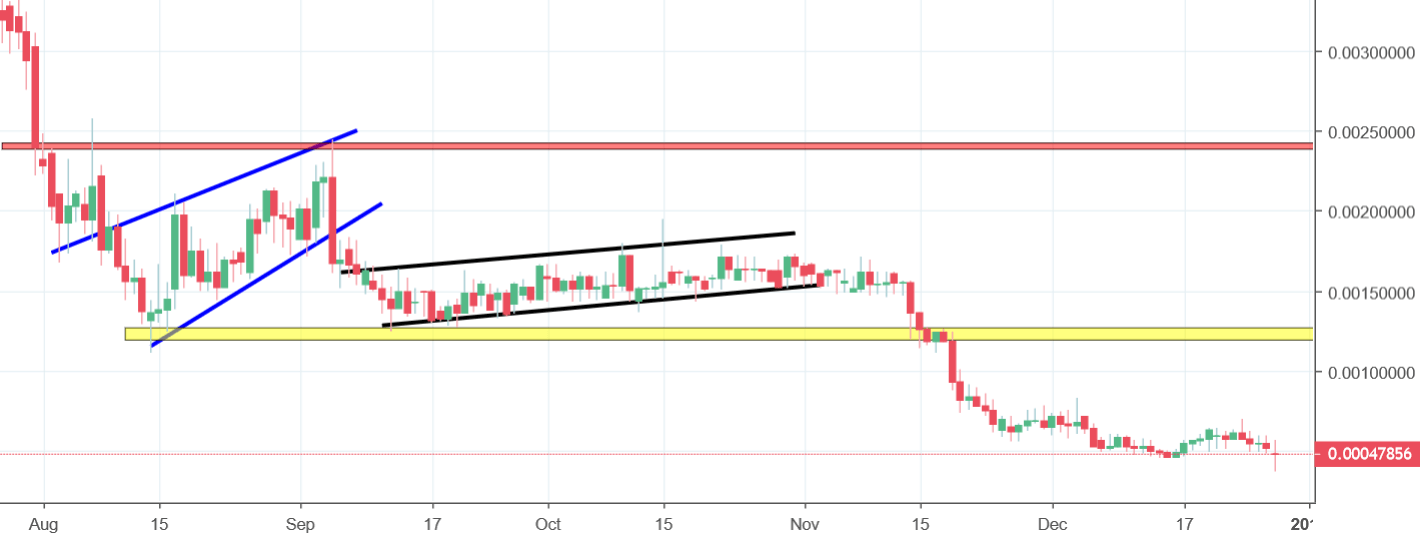
As expected, the flag ended with a breakout to the downside and that happened on the 14th of November, which was actually a remarkable day for the crypto traders. Many altcoins lost it that day. Anyway, since that, the price declined sharply and few days later broke the crucial horizontal support on the 0.0012 USD (yellow). That was the sign for a bigger sell-off, no limits, no breaks. The price went as low as to the 0.0004 USD (how many zeros?) seen actually today. Pretty bad situation to be honest with you. If you think that all time lows is a good occasion to buy, think again. This is a crypto market, where not may people know what they are doing. Unfortunately buying is not an option at this particular moment – the price always can go lower and lower.


Comments (0 comment(s))