Salus (SLS) Analysis – all major supports are broken
From the three coins mentioned today, the last one, has the best technical situation. It is still far from the perfect but at least, is not catastrophic. Sell signals here were triggered just recently and we are still relatively close to the resistances, which creates a possibility that they can be challenged in the nearest future.
In the past few months, Salus was inside of the symmetric triangle pattern. The price escaped from this pattern by breaking the lower line of this formation in the end of May. After that, the price broke two horizontal supports. First one on the 36.8 USD (blue) and the second one on the 26.2 USD (black). According to the price action laws, that created a sell signal.
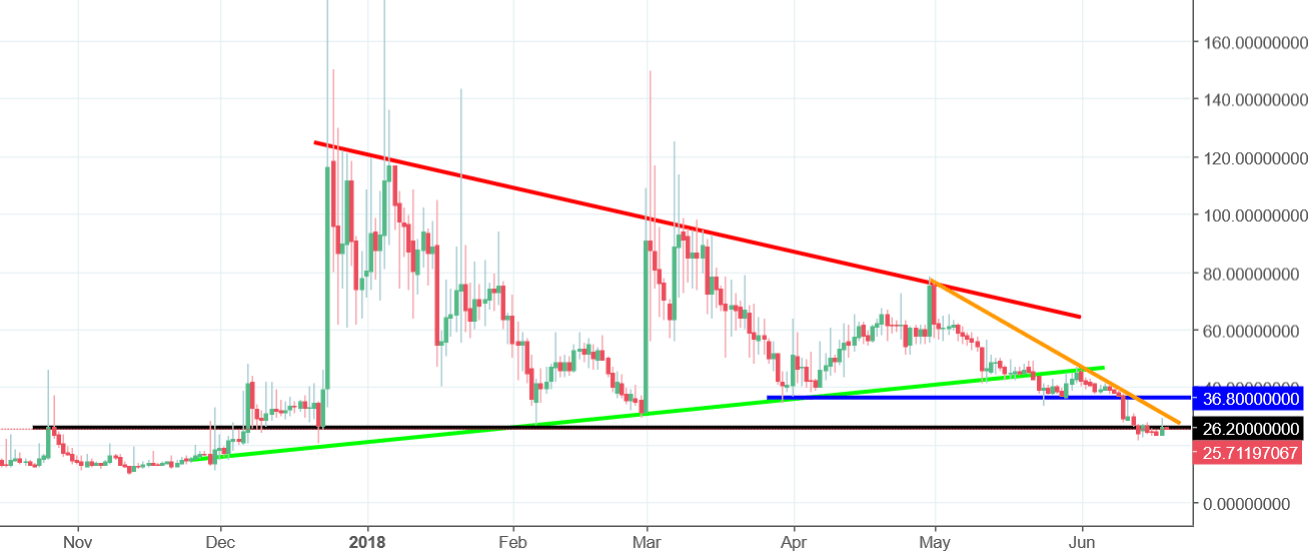
Yesterday, the price tried to come back above the 26.2 USD resistance. They almost made it but eventually failed. Broken support was tested as a resistance and the negative sentiment was confirmed. In addition to horizontal levels, we also do have a mid-term down trendline (orange), which strengtheners us a sell signal.
Negative approach stays here as long as we stay below the blue line. Breakout of the 36.8 USD will be a signal to buy but I would not count on it, at least for now.


Comments (0 comment(s))