SiaCoin Analysis – 14% down in one day? Hold my beer

The biggest loser today is the SiaCoin, which is going down almost 14%. We have to admit that all this was totally predictable as the price moves very technically in the past few months. Last time, we mentioned this instrument on the 10th of October, when we were inside of the flag formation. Back in that day, we were bearish and we saw a great chance for a further drop:
„Price closing a day below the lower black line will be a legitimate sell signal and chances for that are quite high. Buy signal will be triggered, when the price will break the yellow horizontal resistance but this is less likely to happen. „
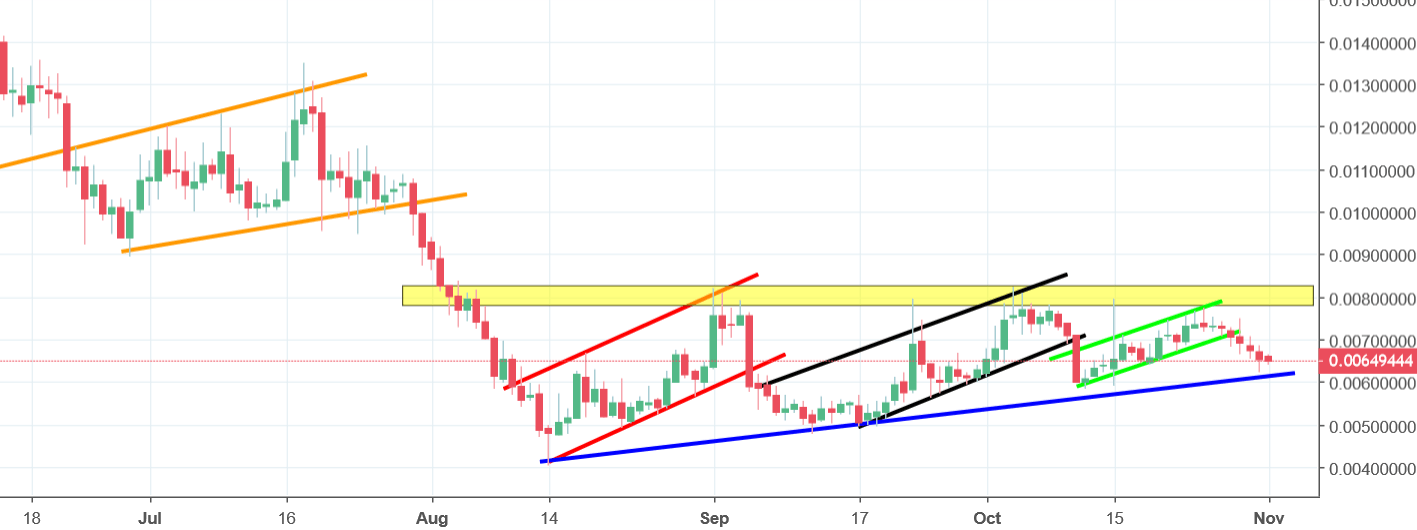
This support mentioned above was broken one day later! After that, the price created another flag (green lines) and on the 28th of October, we broke the support again. Actually, for the SC, we are currently having the 6th bearish day in a row, which shows us the scale of the bearish momentum. In the bigger picture, the price is drawing an ascending triangle pattern (upper yellow, lower blue). In this case, we do have higher chances for the bearish breakout here. The price closing below the blue line will be a legitimate signal to go south and that is our view on this instrument.


Comments (0 comment(s))