Stellar Lumens Analysis – up, up and away

The last day of the week we start with the analysis of the Lumen. The last time, we analysed this instrument on the 29th of March and we were bearish. The price was around the 0.19 USD and we were seeing the further drop, at least towards the 0.15 USD:
„The price did not manage to close above the green area. 0.28 was proven to be a super strong resistance and should be remembered for the future. Orange down trendline is also safe for now. Currently, the price is aiming the lower line of the wedge and the test of the 0.15 seems very probable. We are using a bearish momentum created after the bounce from the 0.28 and the overall negative sentiment towards the cryptos. „
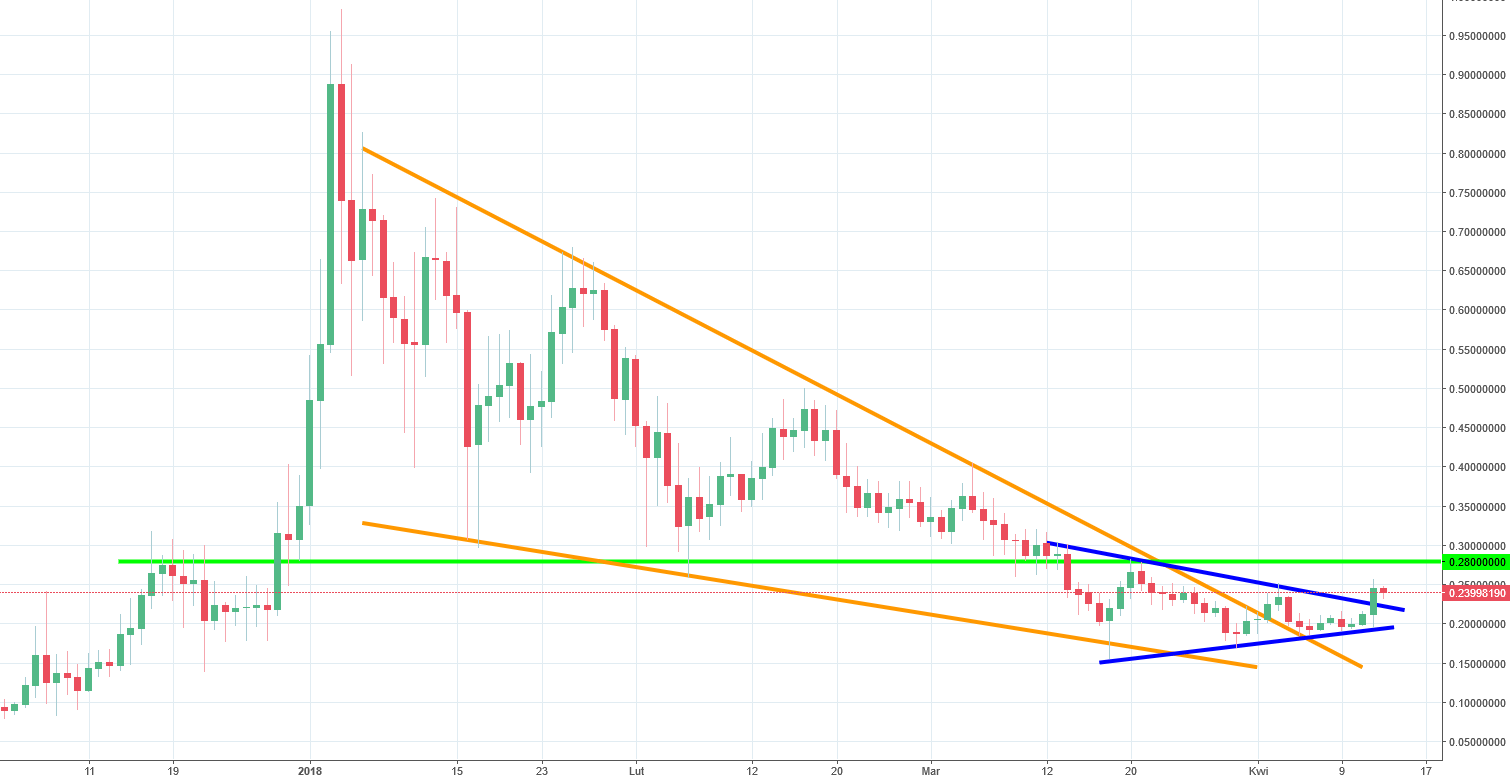
The price reached the low on the 0.16 USD and then went higher. So our view was not fully respected, we missed 0.01 USD 😉 After that, the Lumen created the symmetric triangle pattern (blue lines), which yesterday, resulted in a bullish breakout. That triggers a buy signal here, even though that we did not break the 0.28 USD resistance yet. Why we mention this? Cause in our last piece, we said that this is a strong resistance and should be remembered. Now we will have an occasion to see why. Price testing this level is more or less certain but what will happen after that is unknown. Breakout of the green area will be a very strong buy signal.


Comments (0 comment(s))