GBPUSD Analysis – Still below the crucial resistance

Small update about the Cable. Previously, GBPUSD was mentioned here on the 13th of December and the price was creating the inverse head and shoulders pattern below an important horizontal resistance. That was a first step for the buy signal but we were not there yet. For the signal, you need to see the breakout first, right? This is what we wrote about the Cable few days ago:
“Currently the price is testing the super important horizontal resistance (purple), which interestingly, is in the same place as the dynamic neckline of the iH&S formation (green). Comeback above those two lines would be a legitimate mid-term buy signal. Chances for that are substantial but for the proper signal you still need to wait for the daily candle to close. „
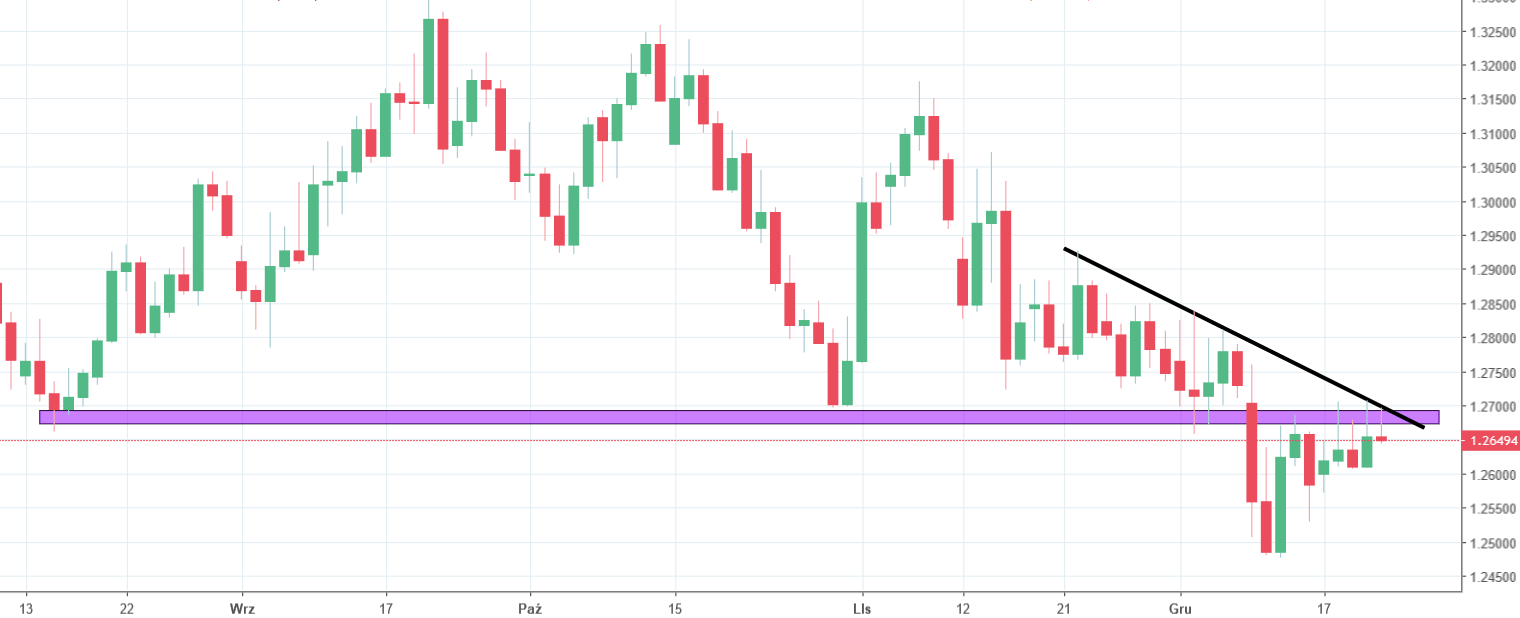
Buyers failed to break the resistance and the price still stays below the purple area. All that rise seen from the 12th of December can be currently perceived only as a correction not a reversal. Look closely on the last few daily candles. All of them have long heads, which shows us that those higher levels were rejected every single time. That is a signal of the strength of this resistance. Additional bearish help comes here from the black mid-term down trendline. As long as we stay below those, the negative sentiments seems untouchable. My view on Cable is bearish.


Comments (0 comment(s))