What are the best forex swing trading strategies? A comprehensive guide
One of the three most popular trading strategies in the World is swing trading. Expert brokers widely consider swing trading as one of the best-suited strategies for a beginner trader. People who are just now starting out in the business will find this trading style to be the easiest to navigate and wrap their heads around.
This isn’t to say that swing trading is unsuitable for others. A wide host of traders with different grades of experience can find significant profits with Swing trading. People with different levels of expertise can find success with this strategy.
What makes swing the simplest entry strategy?
There are several factors that contribute to this, not the least of which is that the time periods in which swing trading usually occurs are manageable both psychologically and professionally. Swing trading sits in the middle between day trading and trend trading.
People that try day trading often find it too unmanageable, energy intensive and time-consuming. Not everyone has either the time or willingness to trade stocks all day, riding the intra-day trends to exhaustion. Trend trading, on the other hand, requires too much willpower and confidence in one’s decisions. Being able to maintain a position for weeks and months on end is a mental and professional challenge, especially for the newcomers on the market. Swing trading takes that sweet spot in-between.
What is swing trading anyway?
Swing trading is, in essence, a fundamentalist strategy. The trader holds a position anywhere from a day to several weeks to get profit. He will later sell the stock based on the intra-week/month movements of their position. A swing trader will try to close the position as close to his profit goals as he can. This approach requires caution because if you close too quickly, you will miss out on more profits and if you hesitate to close the trade, the trend might reverse and you will have missed the opportunity as well.
There are only two types of traders
 Even though the markets are insanely complicated and multi-faceted, some generalisations can still be made. People use a multitude of strategies, tactics, tested or personal rules when trading. Even so, most of these strategies can be described as either trend following or swinging.
Understanding the differences between these strategies is key to profiting from the intricate art of trading. Both of these approaches have their pros and cons. They both have specific rules to be followed. Correctly determining which of these approaches better applies to you is instrumental in becoming a profitable trader with a well-crafted strategy.
Differences between trend traders and swing traders
Trend traders take considerable risks by following trends to a sweet or bitter end. They strap in and keep their positions until the trend reverses. Meanwhile, swing traders have a baseline that they work in. They buy in once the position approaches the support levels and sell once it hits their pre-determined point of resistance. Swing trading is relatively time-constricted, but trend trading can be extended for weeks or months for the duration of the trend.
It’s a good idea to determine which one of these strategies better applies to you and focus your education on it. Professional traders sometimes mix these strategies, creating hybrids, multi-layered portfolios and extremely detailed analysis for higher profit margins. However, you will first need to master each one of them individually. Mixing these strategies requires an excellent division of tasks and risk management to contain them.
Regardless, which strategy you choose, you will require a strong knowledge of technical and/or fundamental analysis to effectively tackle the challenges produced by either. Here are some key moments in both to help you determine which applies better to your specific needs:
Key moments in both approaches to trading
- Position selection: If you want to be a trend trader, you will trade positions with significant uptrends/downtrends. If you decide to become a swing trader, you will watch for trades at support/resistance levels.
- Trade size and frequency: Swing traders generally carry out a bigger number of large trades in shorter time periods. Trend traders hold less and smaller positions for longer. Swing traders also employ more leverage.
- Timing: Swing traders need very good timing since their profit margins are generally smaller. Trend traders, in contrast, might not clock the exact highs and lows of uptrends and downtrends without worrying too much about profits.
- Broad perspective: It goes without saying that trend traders need to be more aware of macroeconomic influences on their positions. Therefore, a trend trader will explore and take into account more general economic or political developments, while a swing trader will focus on the price fluctuations in their controlled time-periods. This applies to a sane extent, naturally. No stock or strategy is immune to macro factors of certain magnitude.
- Pareto Analysis: Markets experience uptrends and downtrends for approximately 20% of the time. The other 80 is spent fluctuating, pulling back, hitting high and low resistance etc. Trend traders strive in that 20%, while swing traders operate during the rest of the economic cycle.
- Entry and exit strategies for these approaches differ as well: Swing traders will enter the market at support or resistance, having stops in place in case they’re wrong. They’ll exit the trade when stops are activated or they reach the profit goal. Trend traders will enter a position when the trend is going strong or try to catch a counter-trend. They won’t exit the trade until the trend changes. Therefore, stops are positioned in a way that corresponds with the trend change price points.
Exploring different swing trading strategies
Swing traders base their decision in these instances on how well the market is performing. If the market is exhibiting strong tendencies one way or the other, the trader might wait extra time to close the deal. However, if the market is weak, he will avoid the risk and close the position earlier. Often, traders will close the position even if their desired goals haven’t been met if they sense that the trend is about to reverse.
There’s a lot of misinformation on the internet about trading. People will actively try to deceive you. Therefore, it’s important to educate yourself on the basics. Here are some strategies within the swing trading strategy to help you achieve your goals:
Picking the appropriate stock
 The most important part of being a swing trader is learning how to pick the appropriate types of stocks for the strategy. By far not all stocks are suitable for this particular kind of trading. The best shares for this purpose belong to companies with the largest market capitalisation values. Only a stock with the market cap of more than 10 billion USD fits that criteria. These companies have the most in-demand stocks on exchanges. Clearly identifiable swings in pricing characterise these stocks in a healthy market. Swing traders identify the occasional up-trends and down-trends of these stocks and ride them out for a few days.
The 1% rule of trading
 The 1 percent rule is one of the most famous and often reiterated rules in trading. Expert brokers around the World advise that it’s much better to consistently make pennies than wait for a lottery-like winning trade. Large positions increase your exposure and consequently, your risks.
A commonly held idea among investors states that no single trade you open should consist of more than 1% of your margin. This is done in order to control losses and minimize the risks. Even though the incremental gains on these positions might discourage some traders, others with a keen eye will notice that they add up to significant sums.
Naturally, this is not a number set in stone. It can vary between 1, 3, 5%, depending on the size and type of the account. For those with a relatively smaller margin, the limit can be increased to 5, 10 or even 20% of the account’s worth. You must find a healthy level of exposure for your individual account. Whatever percentage you choose, you’ll do well to stick a variation of this rule. If more beginner traders adopted this approach, we would probably have less people losing their entire accounts in the first year of trading.
If you follow the 1 percent rule and consistently win more trades than you lose, you’ll see that not only is your margin not deteriorating, it’s increasing faster than you expected.
Options trading
Swing trading can be effectively implemented with options trading as well. Options trading is a good way to see significant gains with this strategy. Options trading can limit your risk level and allow you to trade larger volumes of higher-priced stocks with a relatively smaller account. If your margin isn’t very high, this can prove to be a good pick for your money.
Options trading allows you to leverage your investment, using the basic call and put options. To put it simply, you’ll buy call options if you want to purchase a certain stock and put options if you want to sell it.
Options trading can offer an impressive profit potential on small investments when swing trading. This is what makes options so popular among investors. This is a relatively safe tool to help you realize your trading goals even if your account doesn’t boast millions of dollars in it.
Trading options while swing trading applies to multiple types of markets and situations. The approach utilizes simple principles that help you maximize profit from your initial investment.
Pick the right stock
As we’ve already discussed, this is probably the most important thing to do when tackling stocks. This step is ever so important with options because of their time-based nature. You need to build a curated watchlist with solid stock selection. Then you monitor the price movements on the stocks, explore the catalysts and fundamental reasons behind the fluctuations.
Establish the kind of market you’re in before making any decisions
This will help you make a more informed decision on what stock to buy and how long to hold it for. It’s very different to navigate markets in an extreme state. In order to find a bullish uptrend, look for higher highs and higher lows on the S&P 500 weekly charts. Also, determine the volatility in the market. In order to identify bearish tendencies, look for the rising interest rates, lower highs and lower lows. Energy, basic material and consumer staple stocks will be experiencing decent performances.
Allow the option to pass your strike price.
An effective swing options trading strategy must allow you the time to pass the strike price. A strike price is a price that you’re unaccountably allowed to receive for the option. This is part of the agreement when purchasing an option. If the option you bought is trading at 8 USD, but your strike price is 9 USD, you might consider selling it. This is needed so the call option turns profitable. Otherwise, it will expire without doing anything. Usually, if the contract includes a larger expiration time, it will offer less potential profit. However, the decreased risk level might be worth it for your trade. Monthly options are considered the reasonable middle ground for their decent percentage and moderate risk exposure.
Identify and buy the pullbacks
A well-oiled mechanism of entry and exit points is needed for a successful swing options trader. Patience and diligence are your allies with options trading. Try to buy in when the market is in a pullback. Be extremely careful not to get trapped in a trend reversal, however. Pullbacks are often confused with them. Making this mistake might have grave costs for your portfolio unless you’re diligent with your stop-loss. Reversals usually involve changes in the fundamentals of the stock.
Don’t get carried away
When the market volatility hits the low point, you would do well to reduce the options trading in your portfolio. Options are a time-restricted asset. Don’t let your money decay. If you think the position is going to bounce, just open a new call option next month. This rule is true in all aspects of stock trading. It becomes even more important when options are concerned.
Avoiding market extremes
 As we’ve mentioned, the bear market and the bull market are the enemies of a swing trader. Extreme conditions of the market make correctly predicting the swinging movements of the stock a challenge. In such markets, the stocks that swing traders target take a long time to break a trend. therefore, in these situations, trend traders are the ones who thrive.
If you are to swing trade, your best bet is to do so when the market is relatively stable. When the market is in a lull, the movements are generally quite monotonous. Well, to a reasonable extent. The stock market is still an incredibly unstable environment regardless if it’s bullish or bearish. After all, identifying whether the market is being either of those things is an incredibly challenging task. So challenging in fact, that very few are ever able to correctly identify when these shifts happen.
Breakouts and breakdowns
The breakout approach implies doing due research, tracking stock movements and buying into a position when the uptrend is still young.
A trader keeps a close eye on a trade. When it reaches a pre-defined point of support or resistance, he opens a position. He will need to carefully monitor the volatility and the price movements of the stock in order to correctly time the entrance. This strategy is referred to as a breakout.
A breakdown is the same approach reversed as needed. When the price point dips below the support level, a continued downtrend is expected. Therefore, you’ll bet on the stock losing more of its price and open a position after tracking the same technical and fundamental indicators as in the previous case.
Floating stocks
 A stock float can help you make a decision whether or not you should buy it. The float is defined as the amount of shares available for trading with any specific stock. Outstanding shares, by contrast, include restricted shares as well. This may sound strange, but an excessive number of floating shares is not a good thing. When the available shares exceed healthy percentages, it’s tough for a position to change enough to make you profit. A smaller number of available shares is likelier to show some nice growth.
On the other hand, you don’t want the number of shares available to be too small either. This can cause the stock price to be less flexible. If the stock isn’t being traded in healthy volumes, it might mean that it won’t deliver the swings and fluctuations you need from it.
Short interest
Short interest is connected to our previous topic as well. It looks at the floating shares, looks at the number of shares short and calculates a ratio.
A higher short interest implies bearish market movements with a specific stock. If the stock price is low but the interest is high, this might mean that a short squeeze is taking place. A short squeeze implies that an often shorted stock or commodity will see rapid movement upwards. This will force short sellers to sell their trades, further increasing the stock movement. As the name suggests, a short squeeze basically forces short sellers out of the market for a particular stock. This is usually good news for the stock and bad news for short sellers.
The interest is usually calculated every month. The number is highly speculative and sees little support of its validity from the community. The number includes all shorted shares.
The two approaches to trade management
Depending on what your goals are and how much of your life being a swing trader takes up, you might be an active trader or a passive one. People devote different time, energy and thought to trading. Some are completely reliant on automated trading systems for their portfolio. Others like to be more personally involved in each trade they do.
Passive trade management
 Being a passive trader means establishing clearly defined entry and exit points and letting them do your job for you. You will exit a position only when the trade triggers a stop-loss mechanism or collects your target profit. You’re uninvolved in other movements and decisions.
Traders use this strategy to tune out the often overwhelming noise of the markets movements. The constant updates and fluctuations can get upsetting for some. It might also force you to miss out on certain opportunities because you weren’t filtering the information taken in. Being overwhelmed by information means you’re not focusing on the topics and things you should be focusing on.
Being a passive trader makes the whole ordeal much more mellow and manageable. You predetermine and automate your decisions and go from there. You follow your plan to whatever it may lead you to. However, not paying enough attention to the market’s movements might also mean that you won’t notice some major changes about to happen. The trend could be on a brink of reversal and you won’t be able to react in time. Yes, a stop-loss will ensure your losses will be contained, but why not try and win that trade instead?
Active trade management
 Being actively involved in your decisionmaking is a much more hands-on approach to trading. The trader will carefully monitor the stocks and decide what he wants to do with his positions from there. He’ll still have safety mechanisms in place, but he’ll be less reliant on them.
An active trader might lose fewer trades because he’ll see the pullbacks or trend reversals about to occur and react accordingly. He’ll also be way more stressed. He’s also subject to human emotions getting the better of him. This means the trader might close his positions erroneously in a hurry, missing out on potential profits. It’s a time-intensive approach to swing trading. If you feel like you can devote enough time to it and consistently make good judgement calls, this next strategy might help you.
Simple moving averages
Simple moving averages (SMA) help traders know when to buy or sell a stock. They signal bullish/bearish trends in the market and support/resistance levels.
There are types to SMA. The exponential moving average (EMA) for example. Some also call this method the exponentially weighted moving average. This method of research provides faster trend signals and entry/exit points to a trader. It places more significance on the latest data points. Basic SMA, in contrast, takes all data gathered into equal consideration. This means that the data from EMAs is more recent and therefore more reliable. This is why most traders prefer EMAs over basic SMAs.
EMAs are most effective when swing trading in a trending market. The faster the market moves, the more accurate your data will be. The EMA indicator will react to a consistent uptrend/downtrend and provide a clear uptrend/downtrend itself. They’re often used together with other indicators to improve their accuracy and doublecheck the validity of their advice.
SMA Summary
Even though investors rarely use basic SMA, EMA are not possible without them. To calculate the current EMA, the trader must first calculate the SMA, then calculate the multiplier for smoothing factor of the previous EMA and only then – the current EMA. A swing trader will pinpoint the baseline on the chart using the EMA and hold the position when the stock is in an uptrend. They will short at the baseline once the trend reverses.
The formula for calculating EMA is as follows:
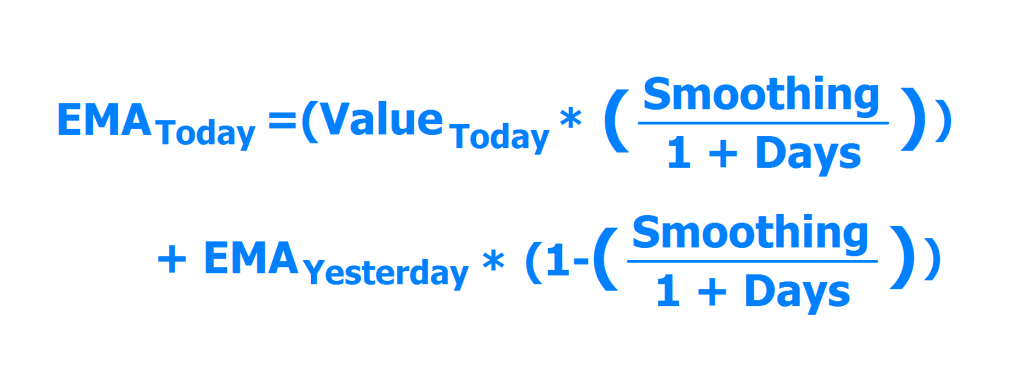
EMA calculation formula
Swing traders aren’t trying to buy a position at the exact moment it reaches the low point and sell it at the highest price point. They’re playing the long game. The baseline is used for confirmation when trading. Whenever the market is more volatile, the trader might wait out the downtrend, despite it hitting the baseline. This means keeping the position even as it dips, hoping for a stronger uptrend.
Swing Trading using Ichimoku Clouds
 Ichimoku Kinkō Hyō (AAL) was developed by a Japanese journalist Goichi Hosoda in the late 1930s. The man perfected the system for 30 years before officially releasing it in 1968. Despite being a widely used technical analysis tool in Asia, the system wasn’t adopted in the West until the 21st century. Over the last two decades, the system has seen wide rates of adoption and has grown a loyal fanbase. Traders around the World are attracted by the versatility of the tool.
The Ichimoku Clouds contain more data than your basic candlestick charts. They’re comprised of five lines creating a graphic environment. These lines work in synergy and create a reference tool for trading decision making. Four lines are calculated by using the high and low points of the previous two sessions. The data changes depending on the variable period lengths, time shifting in either direction by 26 periods. The fifth line is generated by time shifting the current closing price point by these periods. The resulting lines resemble clouds, giving the system its name.
The Ichimoku system is often used in conjunction with Time Theory, Target Price Theory and Wave Movement Theory to further increase the accuracy of the strategy.
How trading signals work with Ichimoku Clouds
The clouds are called Kumo. They mark where the trend is headed. Long exposure is preferred when the price is above the clouds and the reverse applies when it dips below. When the price passes the cloud’s level, that indicates a trend reversal. Dips and pullbacks are used for determining entry points for a trade.
The conversion line, called Tenkan Span, along with the baseline (Kijun Span) provides more entry and exit signals. These two are used to navigate within the existing trends. The price movements along these lines generate momentum-based signals that point to increased momentum suitable for entry or for strengthening the established positions.
The lagging span, called Chikou Span shows a trader the price pattern 26 periods in the past. This feature allows the investor to track and compare the previous month of price movements with the existing patterns. The line is also a clear trend signal. When the line is situated above the current price pattern, it signals a bull trend. When the line runs below, it’s a sign of bearish movements. The larger the distance between the price and the line is, the higher the trend momentum is. A small separation or a crossover point to low trend inertia.
AAL summary
Ichimoku Clouds is an extremely efficient, multi-layered trend analysis tool. The system creates a single, easily digestible graphic image to help a trader make investment decisions. The tool offers information on the price, trend type, momentum, entry and exit points all in one fell swoop. The indicator is highly versatile and provides reliable data both going forwards and backwards in time in any time frame. This makes Ichimoku Clouds a highly recommended tool for swing traders who seek to bring their expertise levels to a professional degree.
Technical indicators for impatient swing traders
 Trading is simple in essence. You buy a position, hold it for a certain amount of time and sell. The differences and complications between trading strategies come into play when the specific time frame is concerned. People like Warren Buffett will buy rising assets and hold onto them for decades, collecting dividends and watching their net worth grow. Others will be unwilling to take years-long risks and seek short-term gains to their portfolio. This is where the issues arise.
In order for a position to become meaningful and profitable, its price needs to grow quickly enough and large enough to counteract the transaction and operational costs along the way. Swing trading is a versatile strategy and it offers calculated rewards to those willing to holds their position for weeks, as well as those who can’t be bothered to wait that long.
Buffett can’t afford to put his assets into an undervalued stock that’s expected to have a short-term bullish uptrend in the future. But a short-term swing trader can. A smaller portfolio provides certain freedoms when trading. Naturally, the payoff is directly proportionate to the investment, but as a smaller trader, one might get more opportunities to act upon.
The indicators such a trader will employ are technical tools that filter usable information out of stock chart price patterns. Needless to say, such actions are inherently speculative. However, if the swing trader is lucky enough, these indicators can provide decent profit margins when gathered and implemented effectively.
On-balance volume
The essence of this theory is relatively uncomplicated. On-balance volume indicators explore the connection between the volume of shares traded and their price. If the number of traded shares in a particular stock is exploding, but the price is unchanged, this indicates an untenable position. The indicator assumes that since the interest in the stock is rising, the price will follow. This logic doesn’t take into account the fact that the trade goes both ways. People might be flocking to buy the stock, but they’re buying it from someone who’s selling. Therefore, the number of people who sell is keeping up with the number of buyers.
In order to arrive at an on-balance volume, we start at a random point in time. Let’s use 3 random days of trading a particular stock with your broker as an example: Suppose on the first day 500 shares are traded at the price of 5 USD per share. The following day the price rises by any amount and the trading volumes reach 700 shares. This sets the on-balance volume indicator at 1200. If on the third day, the price dips and 900 shares are exchanged between investors, the on-balance volume will become 300. Repeat this method for an infinity of time periods using the same principle.
On-balance volume based trading is used pretty much only in short-term decision making. When the price rises, while on-balance volume is lowered, the trader buys in. When the price falls but the volume rises – he sells the position. If these numbers increase and decrease in unison, he doesn’t act at all.
Price rate of change
This indicator examines the latest closing prices compared to previous ones. The trader takes the current price of let’s say 15 USD. Minus the closing price a couple days ago. 13 USD for example. We’ve arrived at 2. Now the trader will divide the number by the old price, arriving at 0.15. That’s the rate change over the time period.
Some investors believe this number provides an estimate of the stock’s level of performance. The further from 0 the final number is, the stronger the uptrend will appear. The price rate of change clocking in at a higher figure is an indicator to buy and vice versa.
Commodity channel index (CCI)
The commodity channel index is an oscillator that explores the relationship between current pricing and the supposed norms. Developed by Donald Lambert in 1980, this particular indicator is a tad more complicated but still employs basic mathematics at its core.
How CCI is calculated
What’s the stock’s regular price? You calculate this number by averaging the high points, low points and closing numbers of the price chart. The calculation can occur over any specific time period. A stock that opens at 5 USD, reaches 9 USD, plummets down to 5 and ends the period at 7 produces a price average of 7 USD.
The second part implies subtracting the SMA over the same time frame. For example, let’s determine the simple moving average over 5 days. Our fictional stock closed at 7 USD on Monday, 6 on Tuesday, 5 and Wednesday, 7 on Thursday and 9 on Friday. This leaves us with the SMA of 6.8 USD. That, in turn, leaves us with a 0.2 USD differential.
We must now produce the mean absolute deviation. For that purpose, we’ll start with the price norm for each of the periods and subtract the smaller number from the bigger one. Then we simply divide the amount by 5, arriving at the mean absolute deviation.
Then we’ll divide that by the 0.2 differential, multiply it by a constant of 1 divided by 0.015 and that’s it. Donald Lambert created this constant to make sure that anywhere between 70 to 80% of calculated commodity channel index values would be between −100 and +100. The constant serves for universal scaling. We’ve now arrived at a number that tells us when the price trend is about to change direction when it will reach the high and low points and with what level of intensity. If the CCI returns a number over 100, the indicator implies to buy. If the number is below -100, you sell.
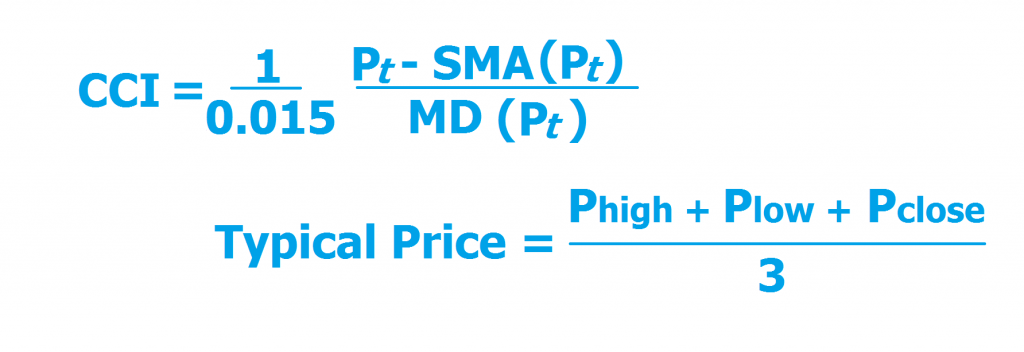
CCI calculation formula
Mostly, the oscillator will recommend neither of these actions. The index is therefore only usable in certain instances.
Always stick to the plan
Technical and fundamental research, crafting a perfect strategy, applying leverage, stop-losses etc. Nothing we’ve discussed means anything unless you follow the plan to a t. This means no sudden risks, no impulse buys, no irrational attachment to trades.
As a swing trader, you need to always be prepared. You must keep track of the entry and exit points and the money you might lose or gain. A swing trader must never hesitate to execute his exit plan. Don’t wait for a rebound. If you exit a losing trade, what’s the big deal? You already had those potential losses accounted for. Don’t wait for more profit either. If you pull the cord on a winning position in a strong uptrend, so what? You already made the money you intended to make on this trade. Even if following the plan means you’ll miss out on bigger gains in one trade, it will save you from bigger losses in two other trades.
We’re all human. It’s easy to get carried away during trading. Considering how our emotions impact our judgement, it’s safe to say that this is one of the most fundamentally important rules you can have as a trader. Don’t endanger the work you’ve put into becoming a trader and crafting a perfect strategy. Stick to the game plan and enjoy the plunder.
Swing trading strategies summary
Humans have yet to create an all-encompassing, faultless analytical tool that gives consistently high-probability indicators to buy, sell or hold a position. In fact, it’s unknown if we ever will. Devising such a system might very well be beyond our capacity (at least in the foreseeable future). This doesn’t mean we won’t try. Professionals of the industry and beyond are constantly working on bettering the tools we have at hand. Meanwhile, the strategies and tools we discussed represent the existing methodology of analysing price fluctuations and mountains of data to help investors make better decisions with their money.
Swing trading offers a wide range of tools, tactics and strategies to choose from. Approaches that have been developed over decades of the trading market evolving, progressing, crashing and rising from the ashes. They have been peer-tested and time-tested. If you’re still decided on becoming an expert swing trader, more research and education into these tools is heavily encouraged. Before you attempt to create a hybrid portfolio or experiment with your own approaches to trading, you should make sure you’re fluent in the fundamentals of the game. Open a demo account with a trusted broker before risking your money. Take calculated risks, consult professionals, keep your expectations low and always have an exit strategy.


Comments (0 comment(s))