DAX Analysis – That looks good
Dollar is stronger, precious metals weaker and how are the indices doing? DAX, for example, is in a good condition and yesterday made new monthly highs. The large influence here comes from the bounce from the neckline that happened on the 11th of September. Back then, situation was not so great…
DAX, for the past few months, was making a giant head and shoulders pattern. On the 11th of September, the price was testing the long-term neckline (blue). Breakout would be a major sell signal but buyers managed to defend it. That brought optimism to the trading floor in Frankfurt. The price climbed higher, breaking the mid-term down trendline (orange) and the mid-term horizontal resistance (green). After that, DAX created a flag (red) and yesterday, used that as a trampoline for a further rise.
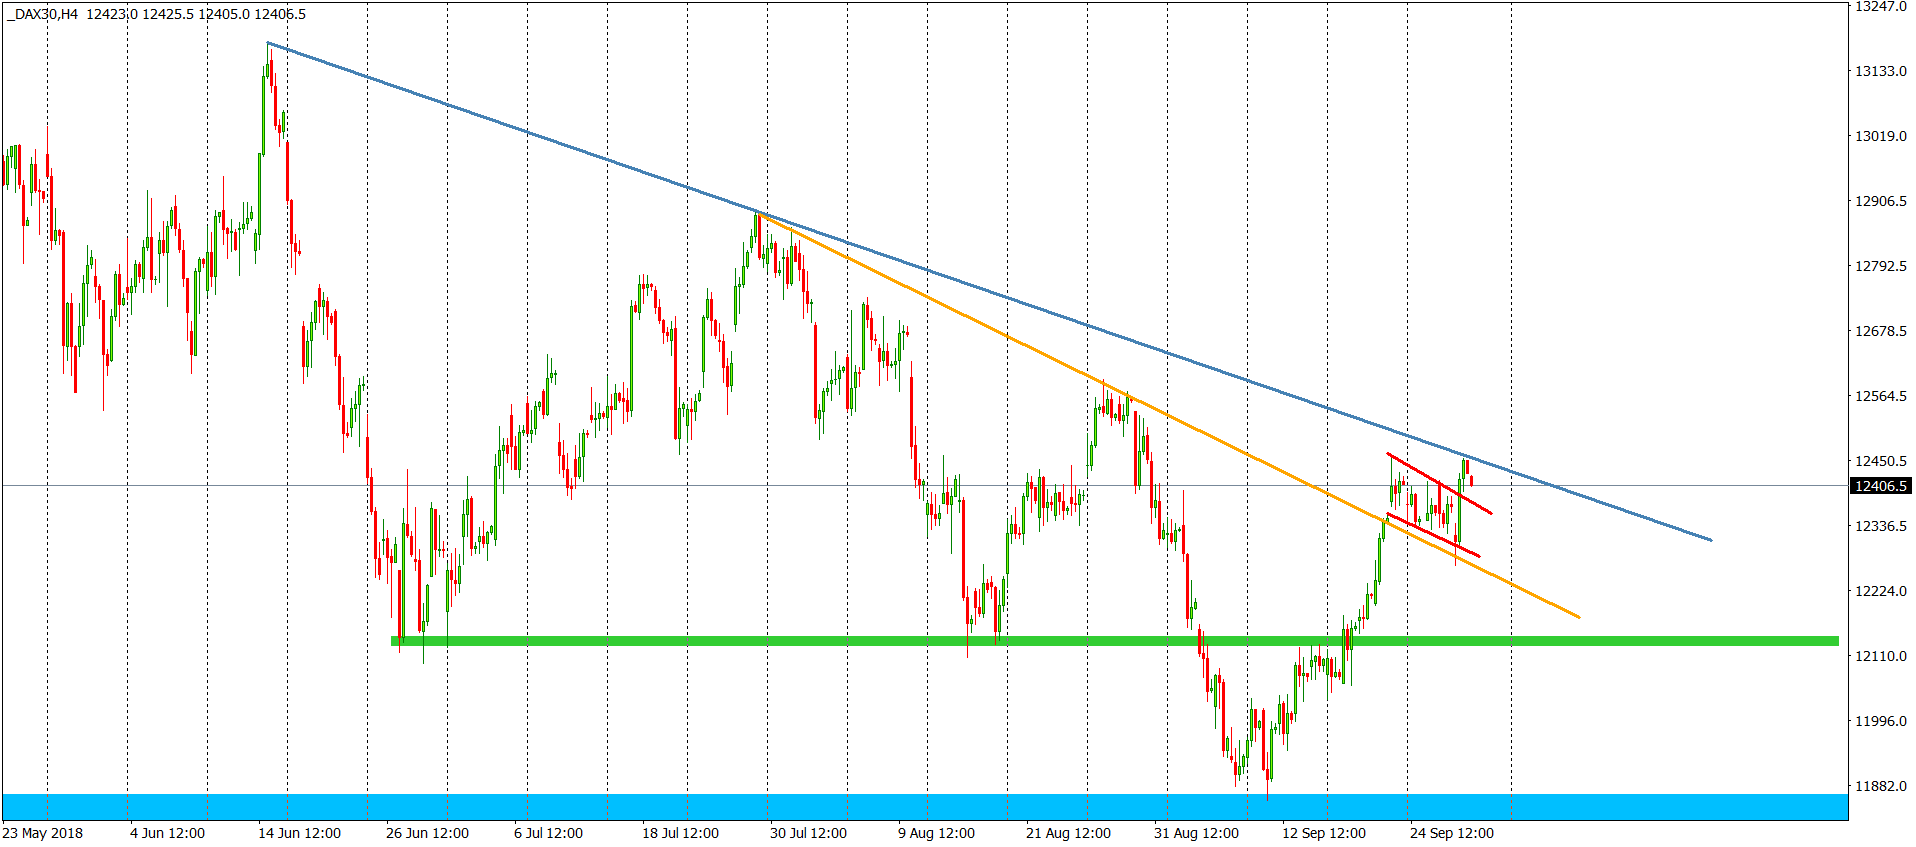
Current stop is not a surprise. The price is testing the line connecting the top of the head and the right shoulder. Breakout here will be a definite buy signal so no surprise that the battle is on!. As for now, buyers have slightly bigger chances for success.


Comments (0 comment(s))