Gold Analysis – Waiting for a breakout

Gold made the long-term lows in the middle of August and since that we do have a bullish reversal. Upswing is rather mild and I guess that bulls were hoping for something more. Buyers lost the momentum at the beginning of the month and are now struggling almost every day.
Currently, the situation is rather bearish. First of all, we are under the first major resistance – 23,6% Fibonacci. What is more, the price is creating a head and shoulders pattern (grey), together with the triangle formation (red). Lower line of the triangle, in the same time, is a neckline of the H&S and is crucial for the mid-term situation on this instrument.
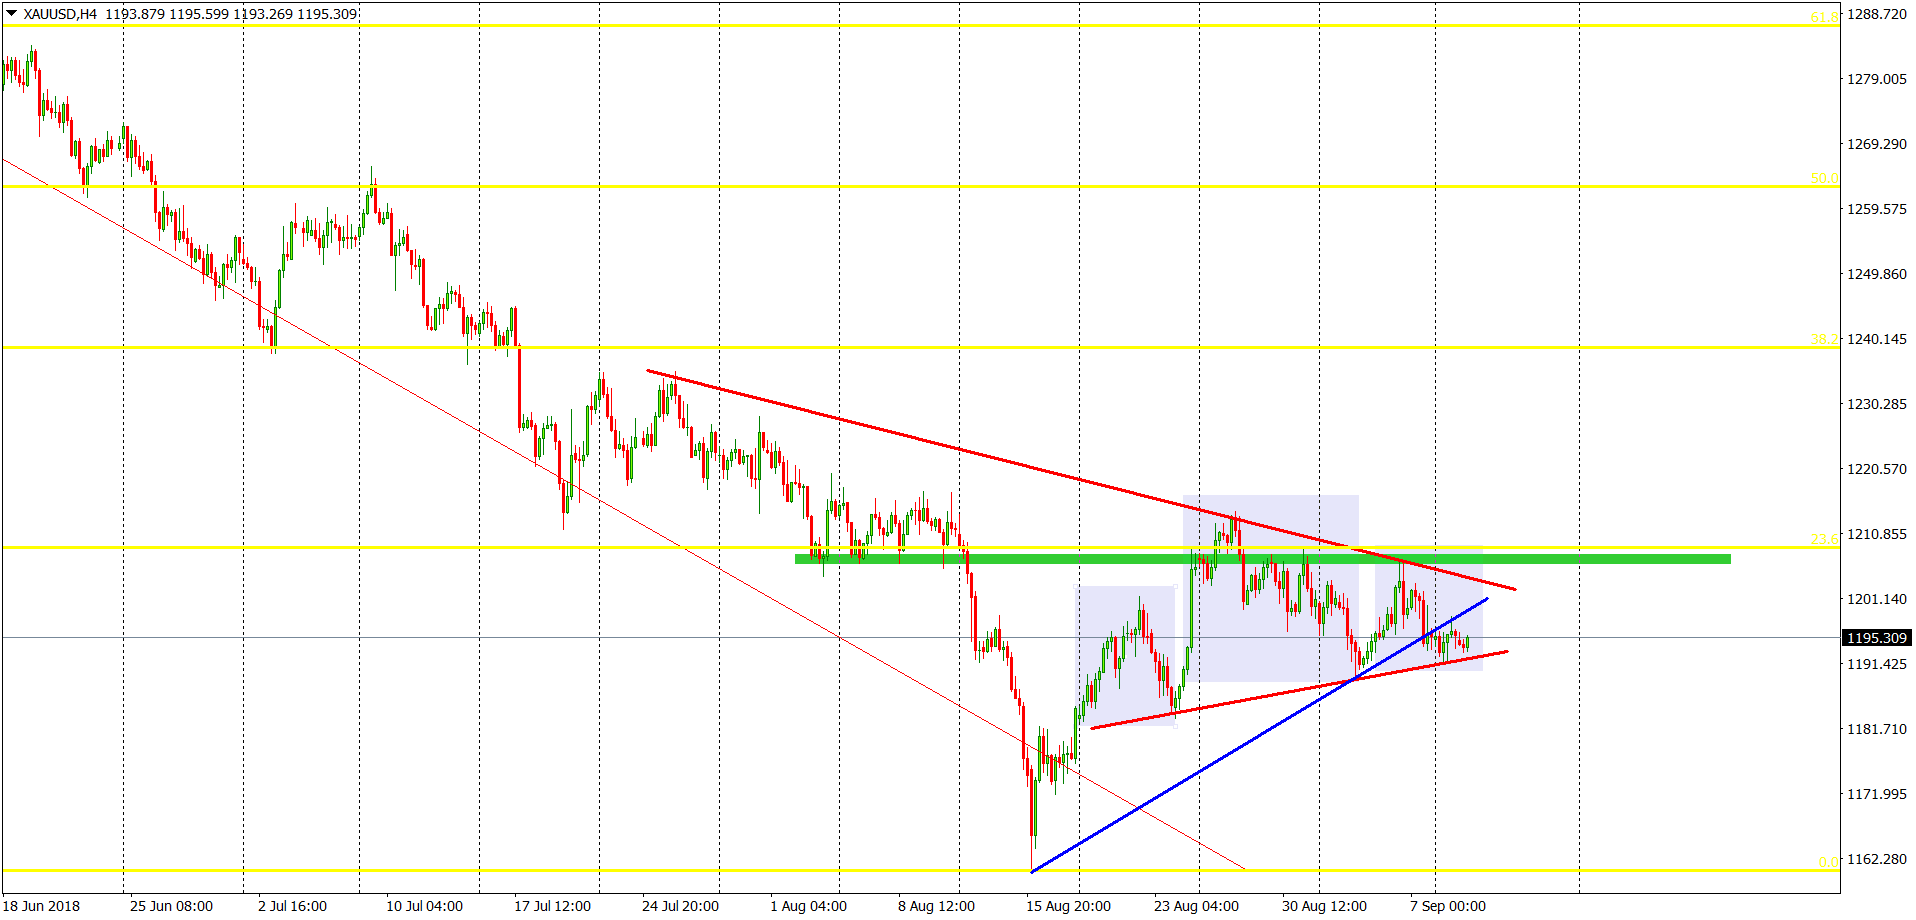
Breakout of the neckline will be a legitimate signal to go short and abandon the bullish dream. On the other hand, breakout of the 23,6% Fibo, will be a positive sign and will set us a target on the next Fibo level – 38,2%.


Comments (0 comment(s))