Nasdaq Analysis – V shape reversal…
Obviously we need to mention indices. Our hero today is the Nasdaq, which performed a very nice V shape reversal. Not that we are surprised. Let me present You, what we wrote in our previous analysis of this instrument, which was published here on the 11th of October:
“as we all know Americans and we are aware of the fact that they love V shape reversals without any particular reason. Watch out for that! „
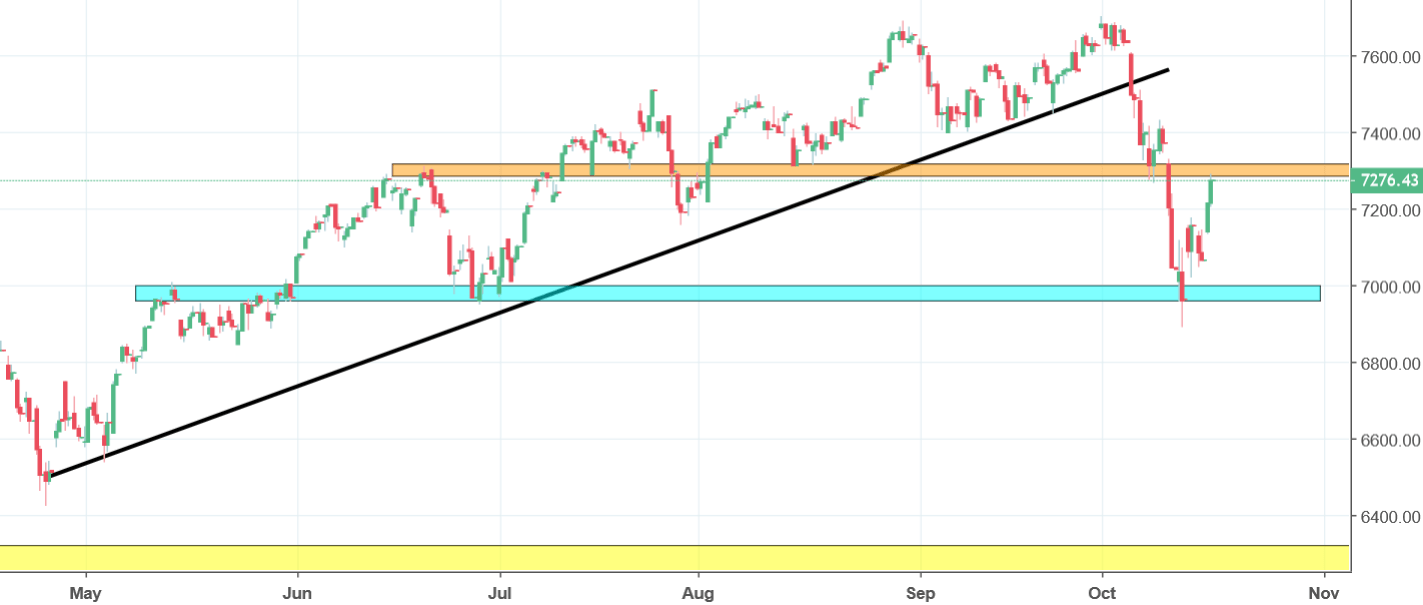
And that is what happened, V shaped reversal as its finest. It did not happen in the random place either. With this movement, the index defended the 7000 points support (blue). Currently, the price is trying to break an important resistance on the 7300 points (orange). In my opinion, as long as we stay below, we do have a sell signal here. Price closing a day above that level will be another invitation to go long.


Comments (0 comment(s))