SP500 Analysis – Approaching a major support

Time to deal with the situation on Stocks, where we continue the bear market and the price is making new lower lows and highs. Our hero of the day will be the SP500, which we previously mentioned on the 9th of October. Back in that day, we were under the bearish pressure but still above major supports. We saw a chance for a bearish breakout in the future though so we said this:
“Daily candle created a hammer and on a smaller timeframes we do have a V-shape reversal. That is absolutely classic for the American Indices. They did that many times before, over and over again. With this kind of setup we cannot be bearish, at least as long as we are above the up trendline.
Price breaking the black line will be a legitimate signal to go down but as for now, we are rather safe.”
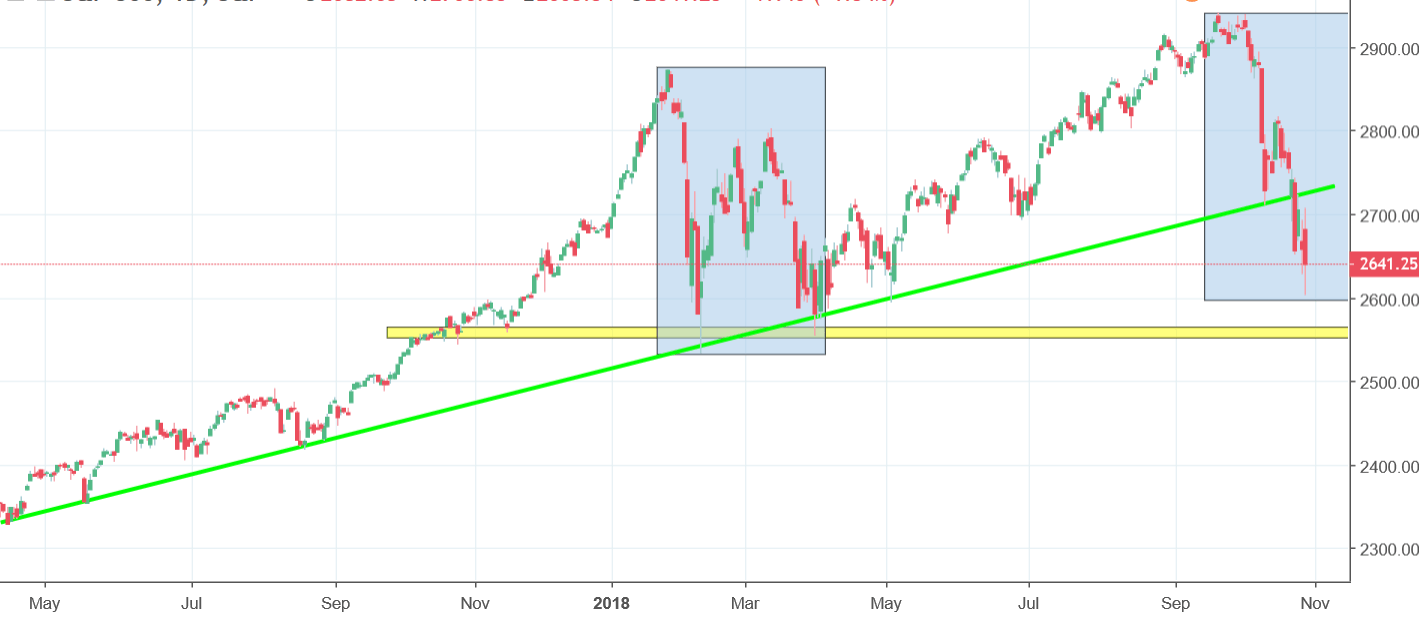
Price broke those supports with relative ease and not so long after those words were written. We all know, what happened later. Currently, the price is making a correction equality pattern (blue), so the current drop has a similar depth to this one from the beginning of the year. That can be an occasion for a reversal but I think that we should go as deep as to the yellow horizontal support around 2555 points. Price getting there can be a good occasion to take some profits.


Comments (0 comment(s))