SP500 Analysis – V shape reversal, again
Today, we have to mention the SP500. Situation here is very interesting as sellers started the October on the front foot and are thinking about a bearish correction. Previously, we talked about the SP500, when the index was making new all time highs…again. This is what we wrote in our last piece:
“The movement itself is very strong and convincing. The sentiment is totally positive and will stay this way as long as we will keep the price above the black up trendline. „
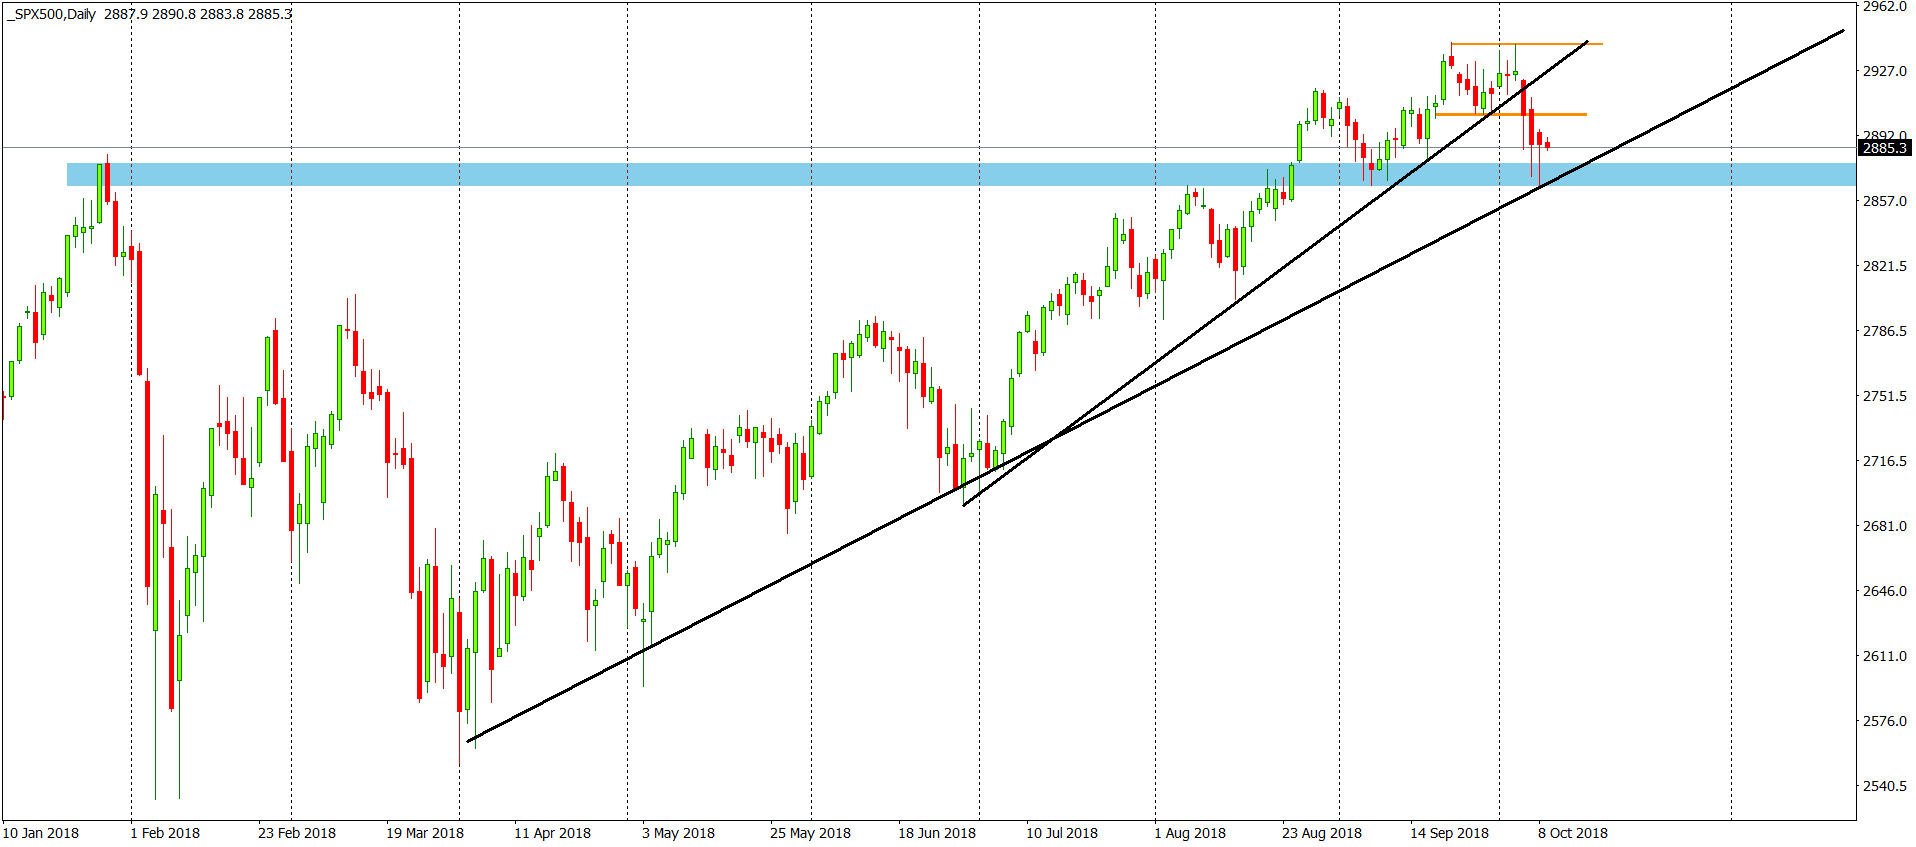
The positive sentiment was here till the 3rd of October. Back in that day, the price created a double top formation, with the shooting star as a second high. That was a signal for a bearish correction. The price went down and broke the first up trendline mentioned above. Yesterday, SP500 made a contact with absolutely crucial support – combination of a horizontal one – (2870, blue) and the dynamic one (long-term up trendline, black). Daily candle created a hammer and on a smaller timeframes we do have a V-shape reversal. That is absolutely classic for the American Indices. They did that many times before, over and over again. With this kind of setup we cannot be bearish, at least as long as we are above the up trendline.
Price breaking the black line will be a legitimate signal to go down but as for now, we are rather safe.


Comments (0 comment(s))