SP500 Analysis – New all time highs!

Although we focus mostly o the cryptos and forex, today, we have to mentioned the SP500. This American Index just hit the new all time highs, again. History likes to repeat itself. Many traders were going short hoping that this is finally the time and again they got smashed by the bullish fever. Well, trading…
This rise was expected though. We saw that coming since the 18th of September. That was the day, when the price bounced from the long—term up trendline (black), which was connecting higher lows since June. The bounce was a V shape reversal (yellow), which is pretty common for the American indices. On Wednesday and Thursday, SPX broke the dynamic and horizontal resistances (red and blue), which opened us a way towards the new highs.
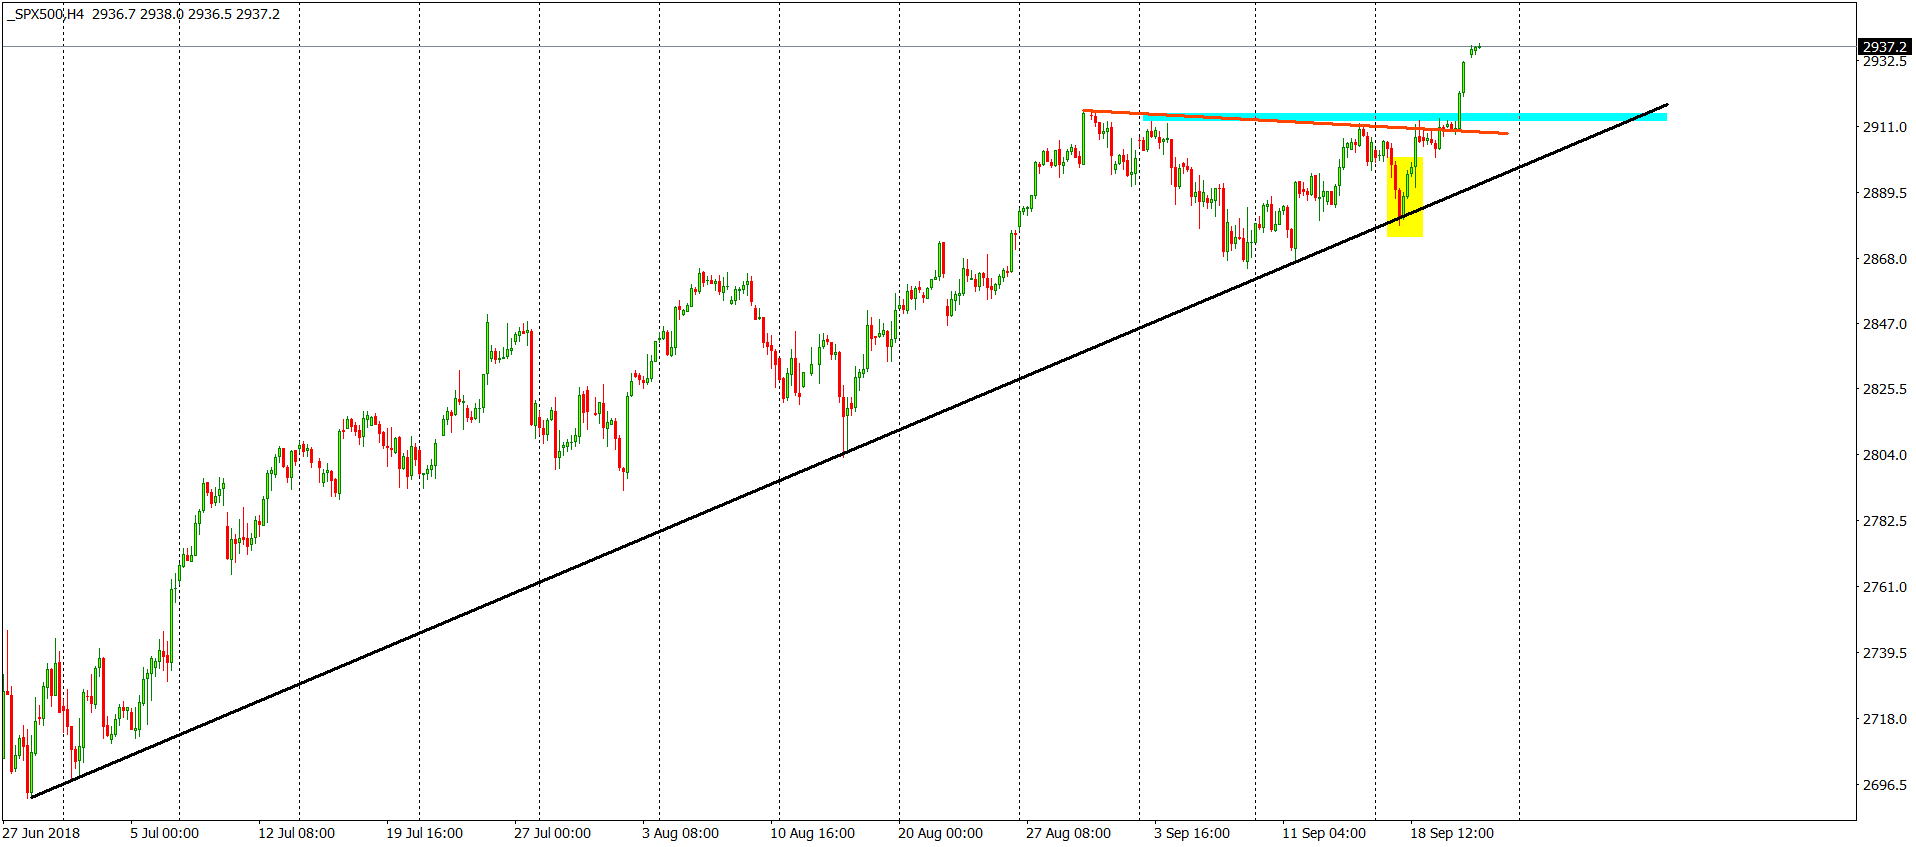
The movement itself is very strong and convincing. The sentiment is totally positive and will stay this way as long as we will keep the price above the black up trendline.


Comments (0 comment(s))