SP500 Analysis – We do have a breakout!

Global stocks start the new week on the back foot. Maybe it is all about the new global tensions between China and US (Huawei, Apple, Qualcomm, South China Sea etc) or maybe just a typical technical movement, I do not know. All I know is that we were right in our previous piece and that we currently have a new sell signal. First, let’s see what we wrote in our previous piece about the SP500 (23rd of November)
„History just loves to repeat itself, so no surprise that in this case we follow the path from the beginning of the year. In my opinion, the scenario of the SP500 reaching the yellow horizontal support is still on the table. „
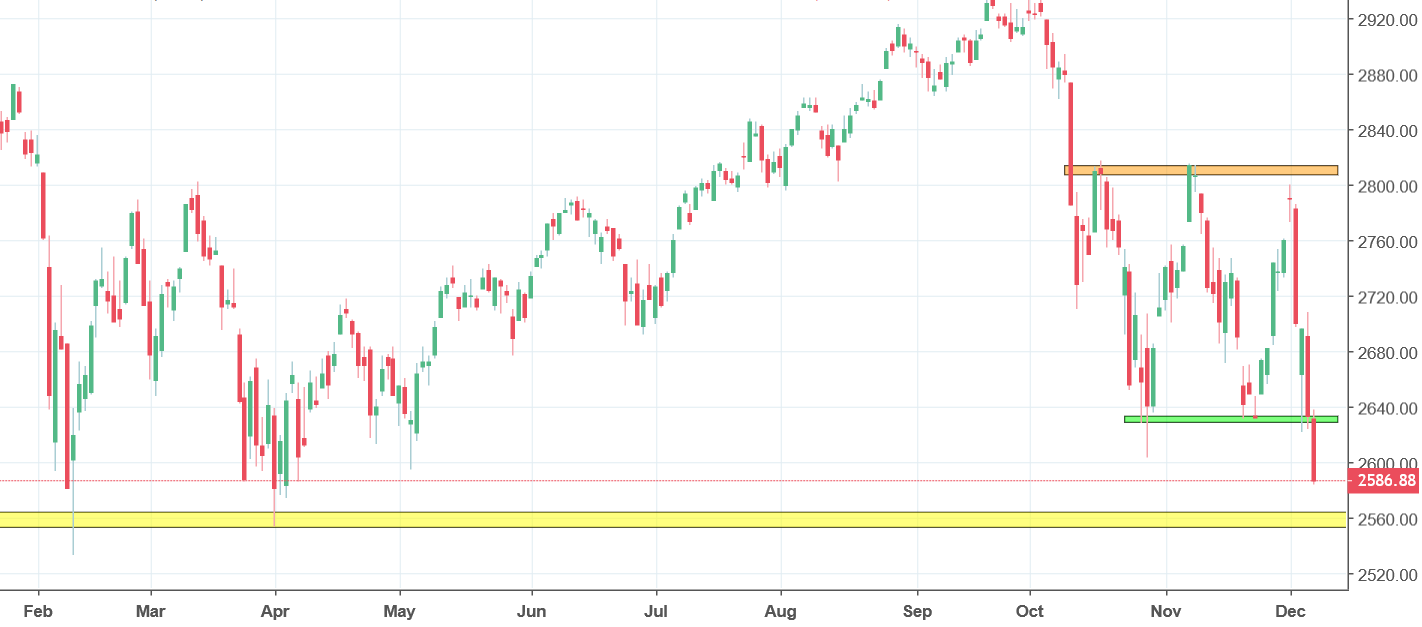
Well, we are currently just 40 points from the yellow support mentioned above. The sell signal that we talked about in the first paragraph comes from the breakout of the green horizontal support. That support was a part of the sideways trend that locked the price from the middle of October (orange, green). Breakout the the downside is a technical invitation to sell. Price coming back above will mean a false breakout and will be a technical invitation to buy but chances for that are limited. Where is the Stock Santa by the way?


Comments (0 comment(s))