SP500 Analysis – iH&S in progress
Thursday’s technical part starts with the analysis of the SP500, which was previously mentioned here on the 8th of November, so exactly a week ago. Back in that day, the price was in a short-term bullish mode, after one week of a continuous recovery. This is what we wrote in our previous piece:
„With all this, the current sentiment has to be positive. Before going full buy mode here, remember that at the beginning of the year, it all looked the same and still, price managed to make new lower lows. „
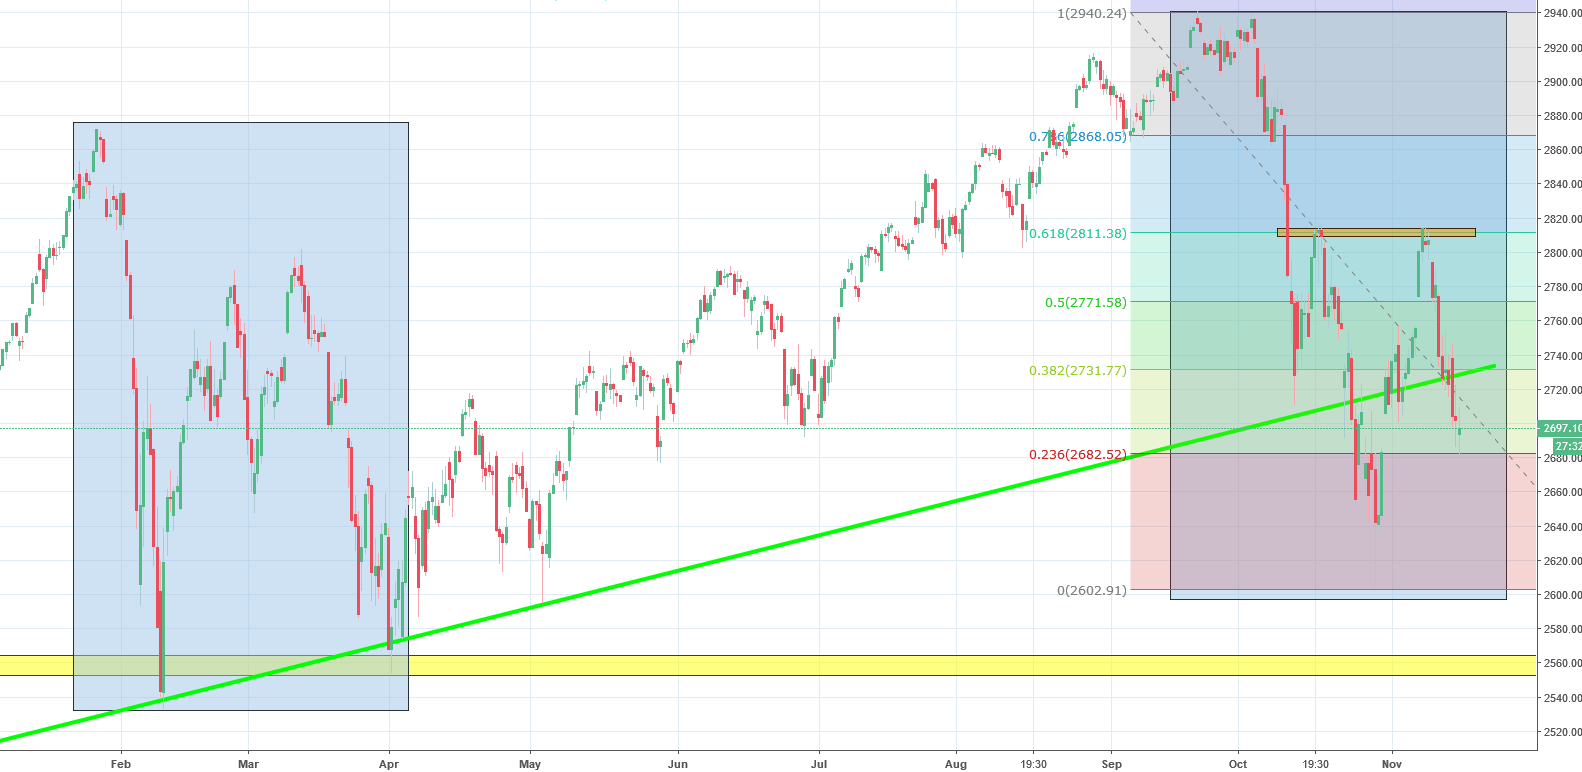
Well, unfortunately that was it for the buyers. Instead of going any higher, the price stopped on the 61.8% Fibonacci (orange). That will be the closest and the most important resistance right now. Today’s session has a chance to finish on the green side of the market. That can be the bottom of the right shoulder. In this case, orange area is the neckline, which only ads the significance here. We have to mention that the price dropped below the long-term up trendline (green), which can be perceived as a negative factor. To sum up, the sell signal is on. Only hope here comes only from the fact that we can have an iH&S formation. ‘Can have’ is still far from a legitimate signal, so traders should not get too optimistic.


Comments (0 comment(s))