WTI Oil Analysis – Still in the triangle

Oil price stacked inside of a sideways trend. Actually, this situation is present since April. Current technical situation promotes both sides. Buyers can see their patterns and sellers can see theirs. The major formation now is the symmetric triangle (black lines) and we are in the middle of this pattern, so in the worst place for trading ever.
According to the price action rules, the outcome of this pattern is unknown. We have equal chances for the bullish and bearish breakout. In the same time, WTI is drawing a head and shoulders pattern (red neckline), which may promote the bearish reversal. May but does not have to as for the proper sell signal, we need to see the breakout of this support first.
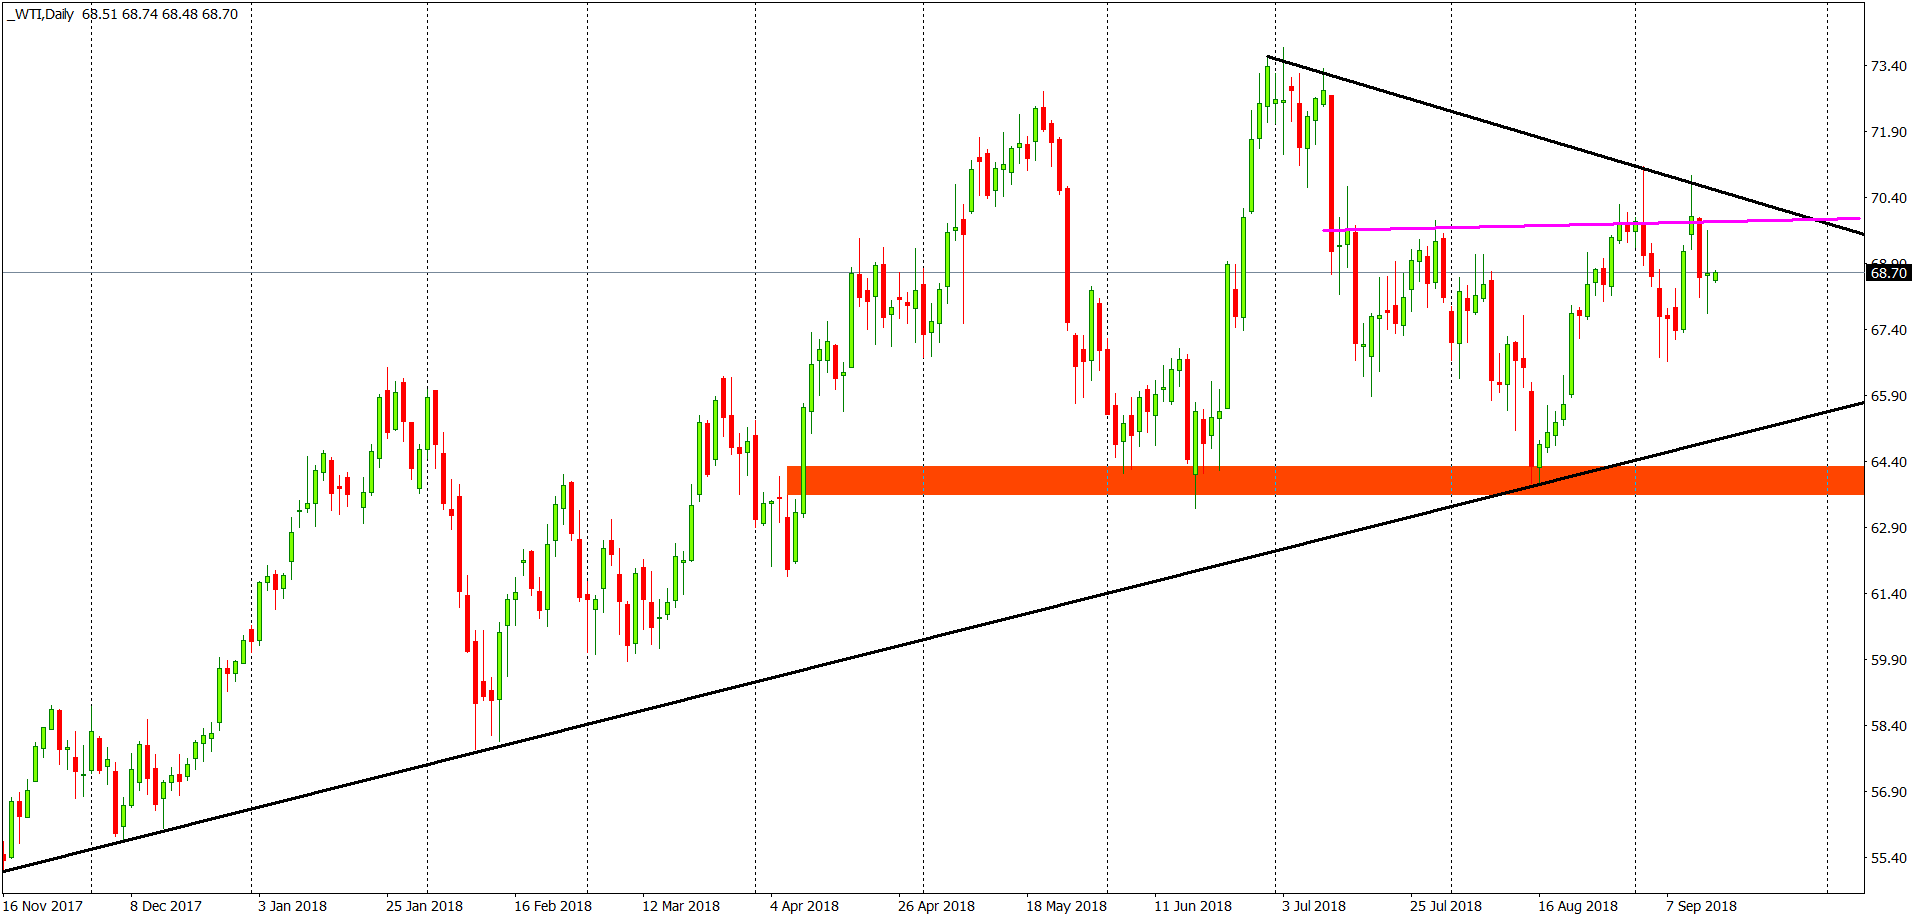
That all looks fine but buyers have their own pattern too and that is an inverse head and shoulders (pink neckline). Smaller one but potentially efficient. Anyway, as it always is with the triangles, we need to see the breakout of the upper or lower line first. That will be only the first step though. The major signal will be triggered, only when the price will break one of the necklines mentioned above.


Comments (0 comment(s))