WTI Oil Analysis – Triangle will show us a direction

The last instrument in the technical part will be the WTI Oil. This instrument was on our radar on the 6th of December and back then, we saw an amazing selling opportunity. We were ahead of the OPEC meeting but that one did not bring us any fireworks, so the price continued to move in a technical manner. First, check out, how we concluded the previous analysis:
„That level brought us a bounce again and a bounce is shaped like head and shoulders pattern. What is more, in the same time we tested the long-term down trendline (black). From the technical point of view that is an amazing selling opportunity! Only if not this OPEC meeting… „
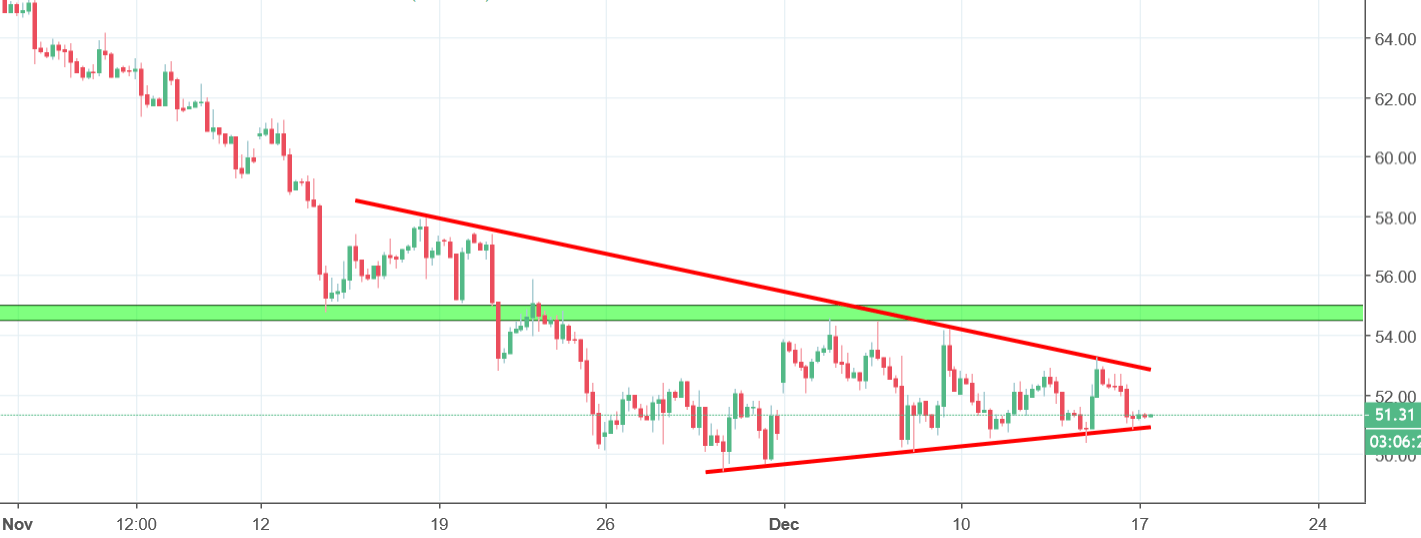
The breakout of the support happened almost immediately. Maybe it was not impressive but it was a size of the head, so from the technical point of view, everything was in line with the protocol. In general, the price is now moving sideways, forming a larger symmetric triangle pattern (red lines). Monday strays with the Oil close to the support, which creates a chance for a bearish breakout. Price closing a day below the lower red line will be a proper buy signal.


Comments (0 comment(s))