0x Analysis – Waiting for the breakout

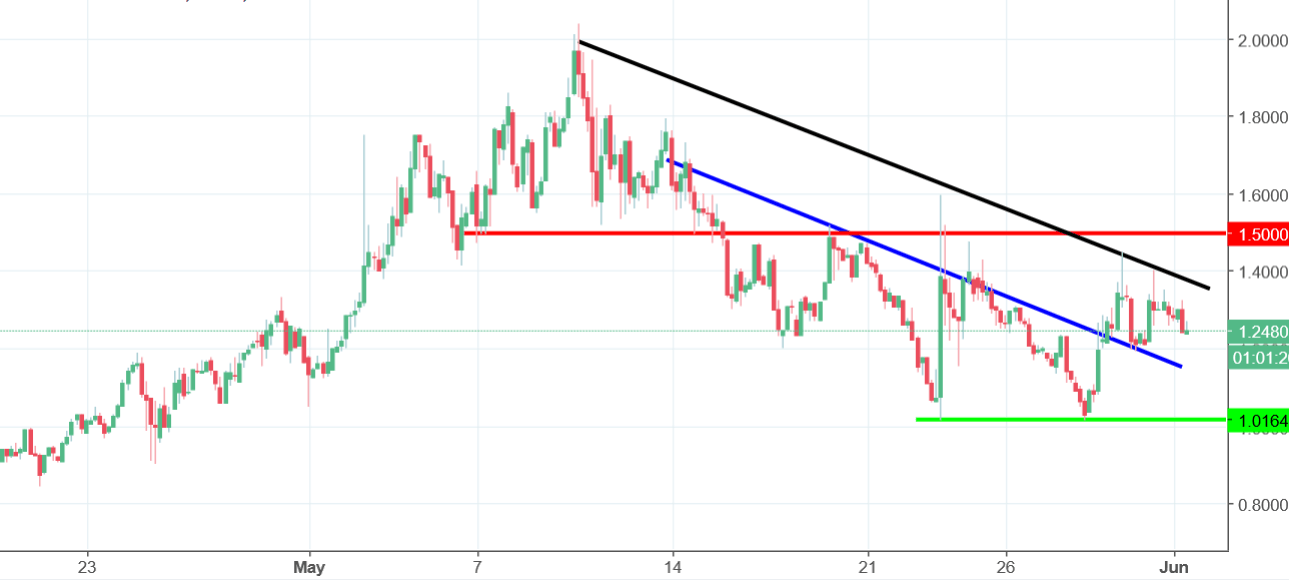
In the last analysis of this week, we will have a debutant – 0x. Unfortunately, we do not have a trading signal here yet but we should get one soon, so this one is for the patient traders. Currently, the price is in the middle between two resistances and two supports and we are waiting for the breakout.
Let me start with the supports. The price is above the horizontal one on the 1.01 USD (green), which stopped the drop in the past few days. The second one is dynamic (blue) and is a neckline of the inverse head and shoulders pattern. In theory, that should promote a strong upswing but as we can see, buyers are hesitating.

As for the resistances, we also do have dynamic and static one. The first one is the mid-term down trendline, connecting lower highs since the 10th of May (black) and the second one is the red line on the 1.5 USD.
How to trade this?
It is simple. Breakout of two resistances, so the price climbing above the 1.5 USD, should trigger us a buy signal. On the other hand, price dropping below the 1.01 USD will be a negative factor and will give us a sell signal.


Comments (0 comment(s))