BitBay Analysis – seems like we are heading lower
The last one for today is the BitBay and we also have a mixed situation here but with slightly more risks to the downside.
In the previous two pieces, we were starting with the positive factors, so we will keep it that way and I will show You first, what bullish factors we can spot on the chart. The first one is the flag (red lines), which is a trend continuation pattern. Trend before creating the flag was bullish, so the formation itself promotes a breakout of the upper line and a further rise. In addition to this, flag can be considered as a right shoulder of the inverse head and shoulders formation, which may be looming on the chart right now. The signal from this pattern comes only after the breakout of the neckline so maybe now it is a bit too early to even mention this possibility.
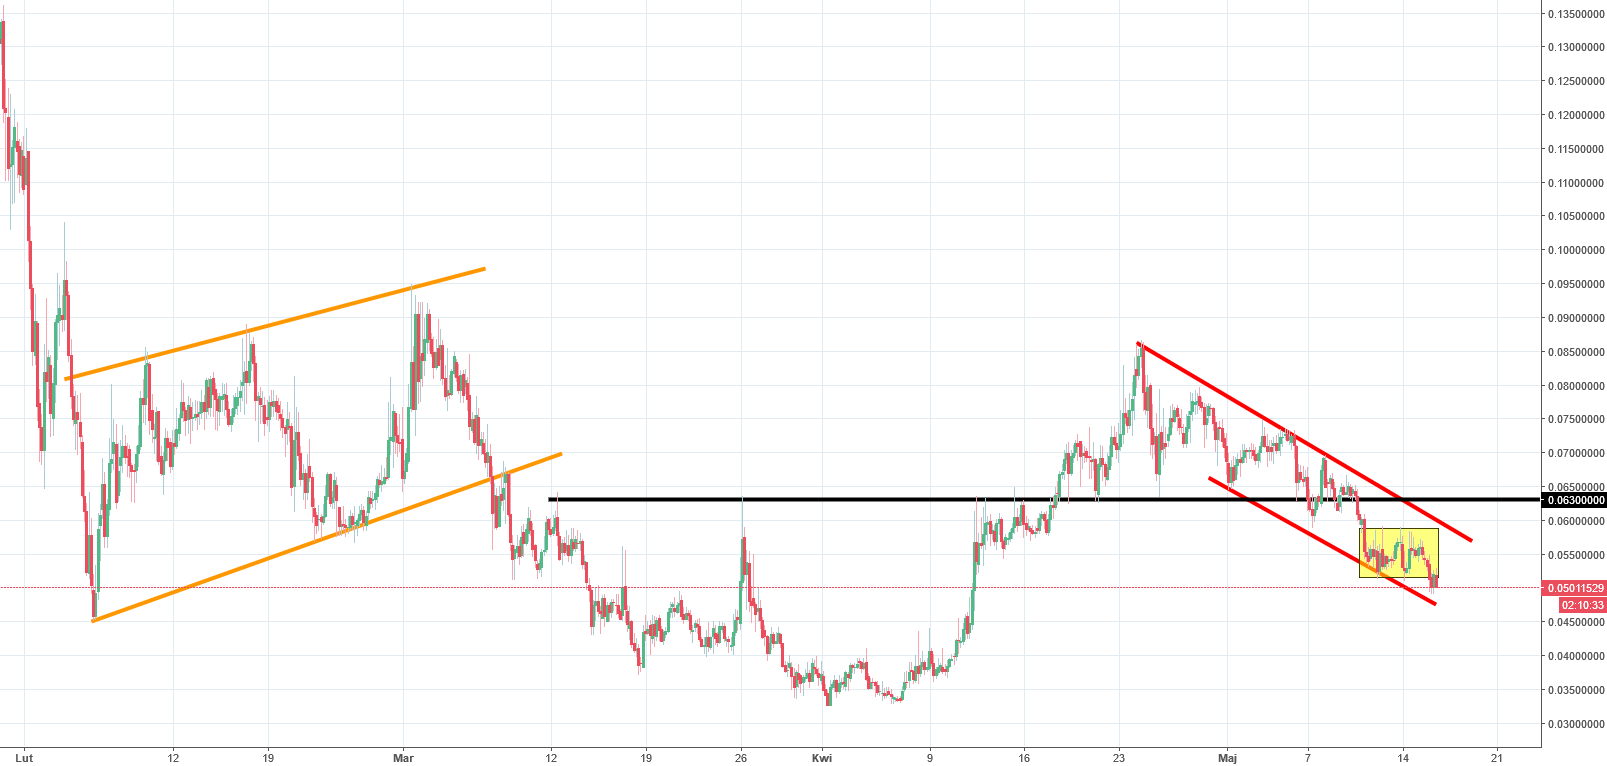
Negative factors are as follows: The main trend is bearish and in the mid-term, the price is making lower lows and lower highs. The flag is a bit long and it may end as a channel down formation, which will give an opposite sign to the original pattern. Most recently, we created a rectangle (yellow), which resulted with a bearish breakout, setting the short-term signal to sell. On top of that, price fell back below the 0.063 support (black), which was important since the middle of March.
Outcome of all that is the same as in the previous two coins: It seems that we should experience a further drop.


Comments (0 comment(s))